
What is a curve control?
The curve can visually display the changes in data, such as upward or downward trends. The data collected by the MCU is sent to the screen in order, and then the curve control is used to connect the sampled data points into a curve for display. The X-axis represents the number of data sampling points, and the Y-axis represents the data sampling values
Scope of application: Full series
Routine download link: "<"Curve control application(Click to jump)
9.1 Curve control properties
This section focuses on introducing the properties of curve controls. The property window is shown below
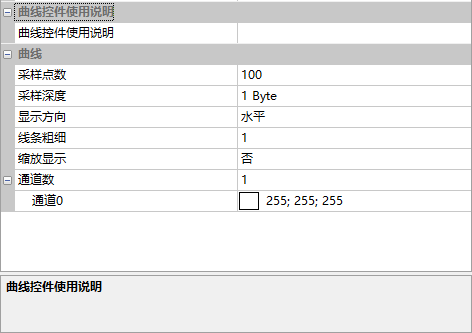
number of sampling points
The curve displays the number of points for one round from left to right across the entire width of the control, as shown below
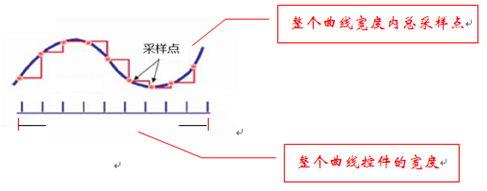
For example, if the curve width is set to 480 pixels and the number of sampling points is set to 480, with 1 pixel point corresponding to 1 curve sampling data, then exactly 480 data are needed to display the entire curve width. When the 481st data arrives, the FIFO data is updated, and the curve shifts to the right for display. If the curve width is 200 pixels and the number of sampling points is 201, the entire control width can only display 200 sampling points. Therefore, when the 201st curve data point arrives, the curve displayed on the screen will start to shift to the right for display
Sampling depth
The number of bytes occupied by one sample of data. "1Byte" and "2Byte" are optional, with the default being 1Byte
Display Direction
The display direction of the curve, which can be divided into "Horizontal" and "Vertical"
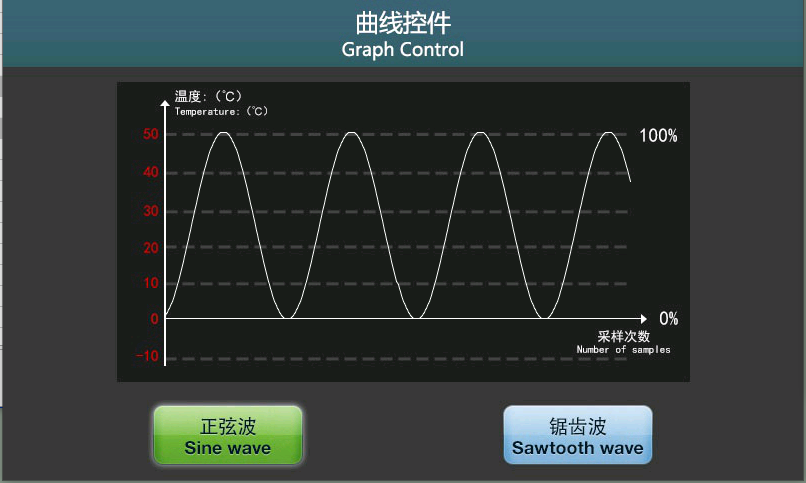
Horizontal Display, with the effect shown below
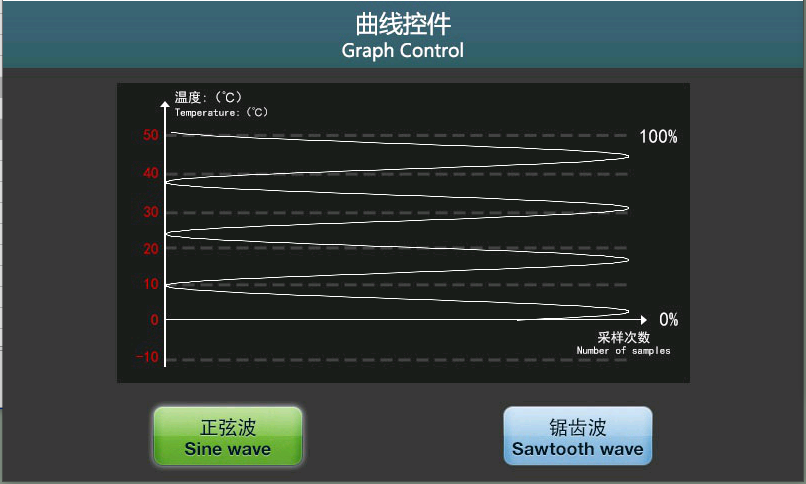
Vertical Display, with the effect shown below
Line Thickness
Set the line thickness of the curve, with four levels to choose from: 1, 2, 3, and 4
Zoom Display
Enable zooming. After setting the start and end values for zooming, the curve will stretch up and down within the range of these two values
Assuming we set the start value to 0 and the end value to 255, the curve will be scaled proportionally within the control range of the curve control from 0 to 255, as shown below
Assuming the height of the curve is 200, for a sine curve without zooming enabled, data with values exceeding 200 on the Y-axis will not be displayed, as shown below
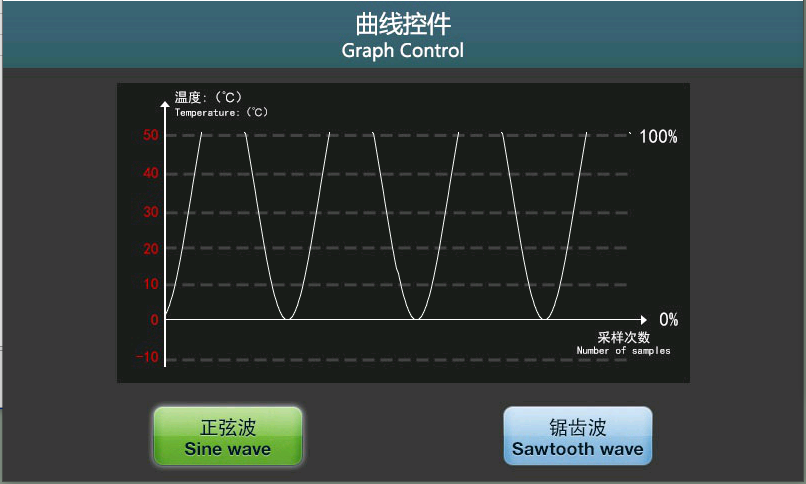
Channel Value
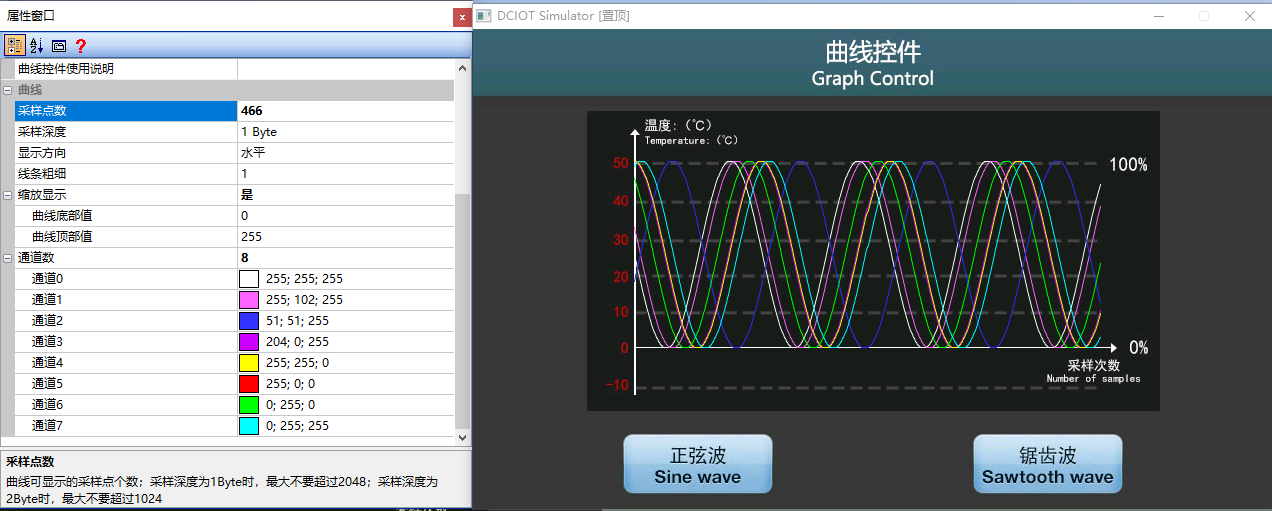
Up to 8 channels can be preset. Each channel can be set with different colors, which helps distinguish between different channels. Colors can be set in HSB mode and RGB mode, as shown below
9.2 Curve Control Application
The [Curve Control] interface introduces how the user device sends instructions to the serial port screen during communication, displaying real-time curves
Screen Configuration
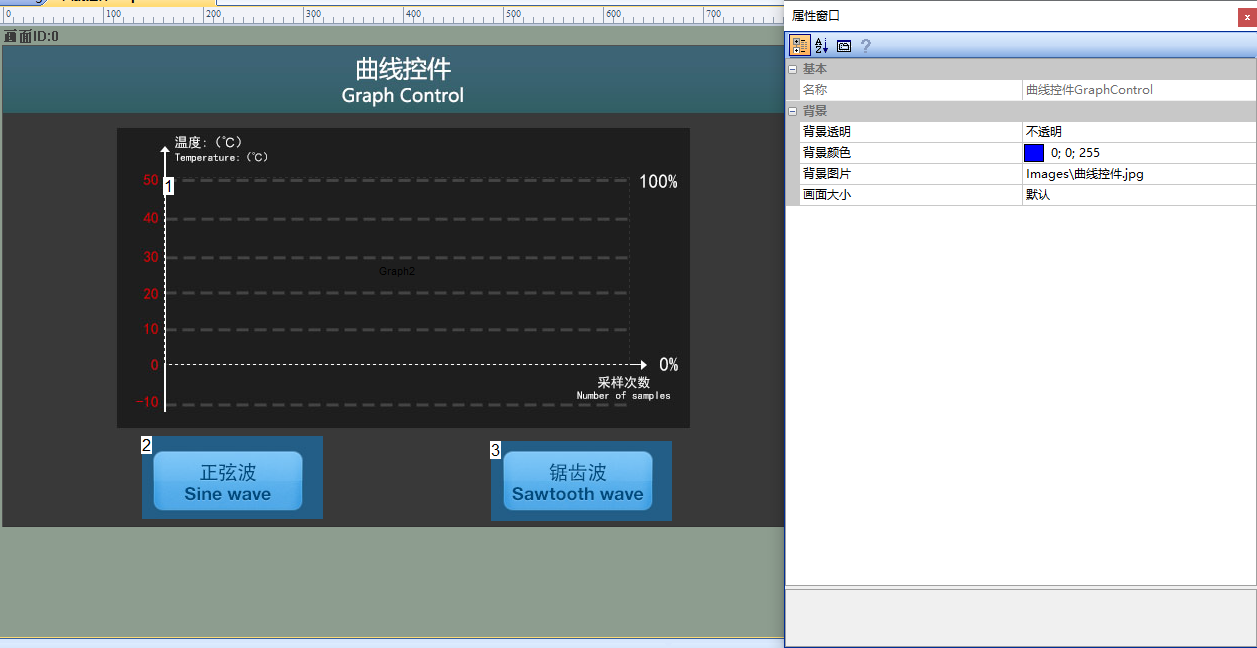
Import the corresponding artwork image for the "Background Image" on the "Curve Controls" screen. Add curve controls and button controls on this screen as shown below
Attribute Configuration
Curve Attribute Configuration
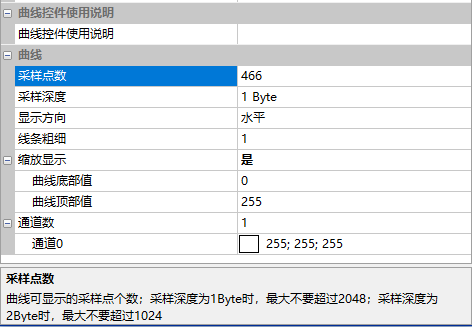
Set the "Number of Sampling Points" to "466", "Sampling Depth" to "1 Byte", "Display Direction" to "Horizontal", "Line Thickness" to "1", "Zoom Display" to "Yes", "Curve Bottom Value" to "0", "Curve Top Value" to "255", and "Number of Channels" to "1", as shown below
Button Attribute Configuration
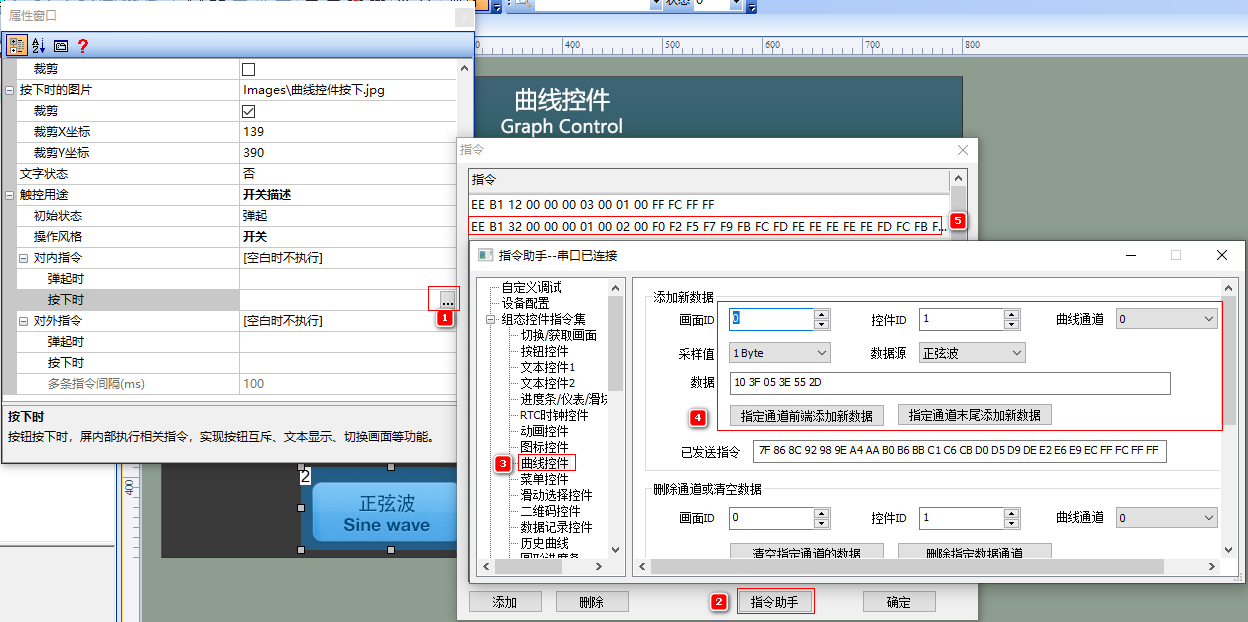
Configuration method for sine wave button: Open the "Command Assistant", select "Curve Controls" from the left navigation bar in the Command Assistant, then click on "Generate Sine Wave Command" in the window, and add the command to the internal commands of the button control. The operation is shown below. The configuration for the sawtooth wave button is similar
Run Preview
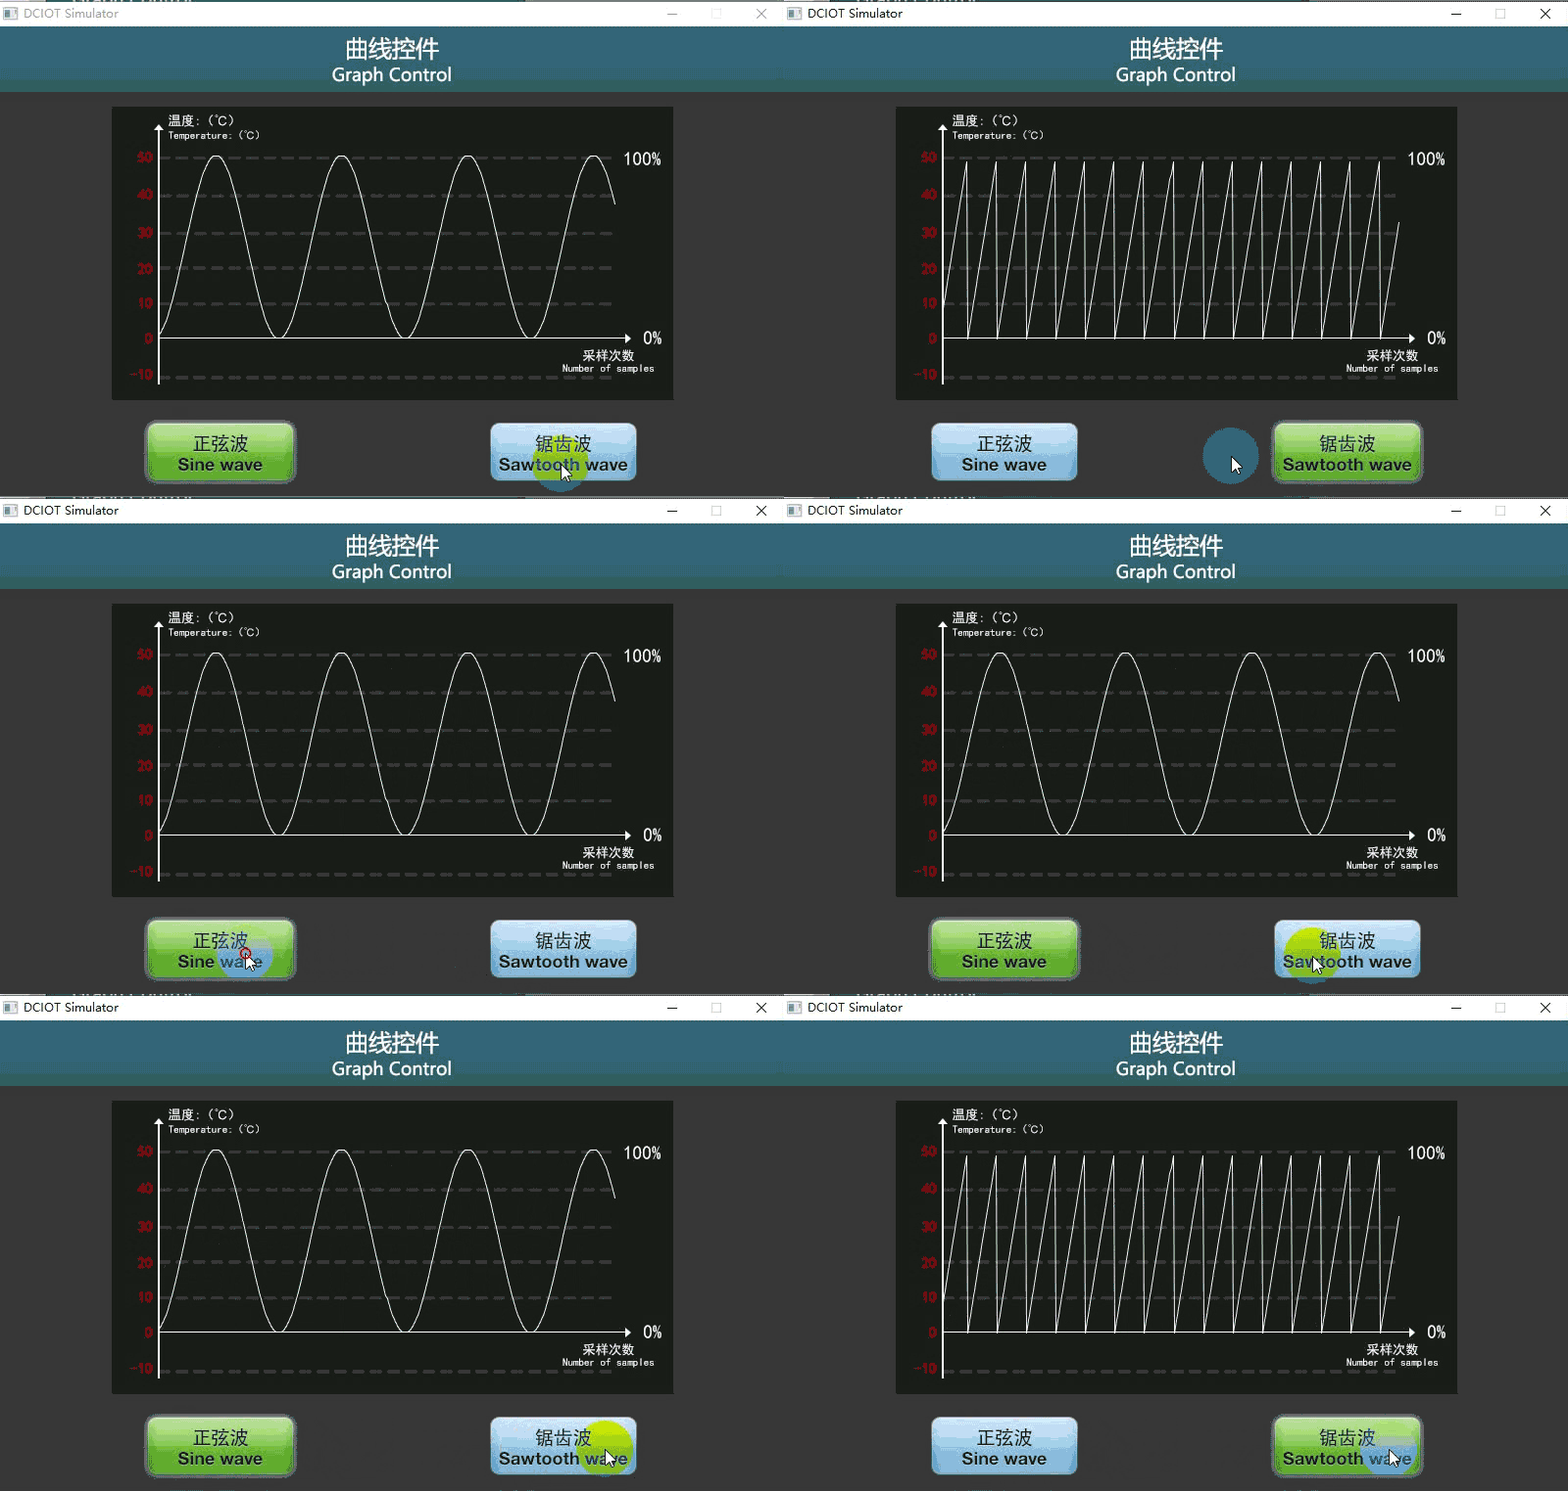
Run the virtual display, click the sinusoid button in the screen, and the screen is as shown below
External MCU control
Refer to the function declarations in the him.dever.h file and the definitions in the him.dever.c file in the Keil development package. For example, if the user needs to implement "curve display", they can directly call the function GraphChannelDataAdd() to add curve data, as shown below:
/************************************************************************
** Function name:    void GraphChannelDataAdd(uint16 screen_id,
**                                            uint16 control_id,
**                                            uchar channel
**                                            uint8 *pData,
**                                            uint16 nDataLen);
** Descriptions    :    曲线控件-添加数据
** input parameters:    screen_id 画面ID
**                      control_id 控件ID
**                      channel 通道号
**                      pData 曲线数据
**                      nDataLen 数据个数
** output parameters: 无
** Returned value   : 无
************************************************************************/
{
    ......
    //添加曲线数据一共256个,请参考源代码
    uint8 sin[256]={};

    //添加数据到曲线 一次两个数据
    GraphChannelDataAdd(0,1,0,&sin[num],2);

}

Leave a Reply