1、 Industry pain points
The four core challenges of traditional water supply models constrain efficiency and safety:
- Traditional rooftop water tank / High level water tanks are prone to breeding algae, insects, and ants, and secondary pollution directly threatens water safety.
- Manually starting and stopping the water pump and adjusting the valve based on experience are common occurrences “Big horse pulling small car” Or “A small horse pulling a large cart”Serious energy waste and shortened equipment lifespan.
- Malfunctions such as pipe burst, dry pumping, and overvoltage are difficult to detect in a timely manner, which can easily cause flooding of pump rooms and motor burnout, with a single repair cost of tens of thousands of yuan.
- In unmanned scenarios such as high-rise residential areas, remote orchards, and nighttime water use, the disposal of leaks and spills is lagging behind, and losses continue to expand.
2、 System positioning
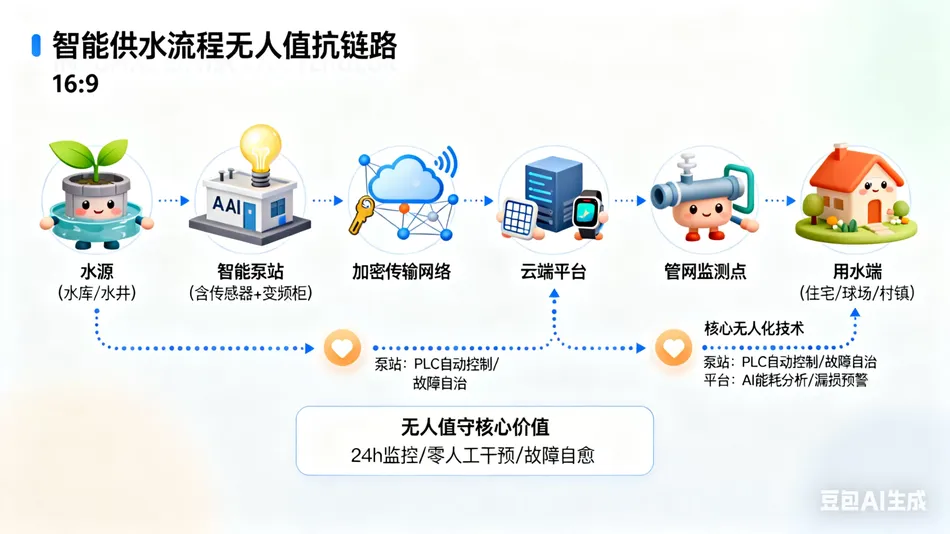
To “Sensors + Edge computing + Cloud collaboration” Replace manual inspection and connect “source of water — Pump station — Pipeline network — Water end” Digitization of the entire chain. Make the water pump follow the water demand “Accurate frequency conversion running”Before the malfunction occurs “Proactive warning”Management is thousands of miles away “Real time visualization”Thoroughly solve the inefficiency and risks of traditional water supply.
3、 Architecture Overview
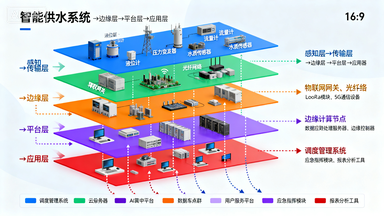
Image descriptionHierarchical display from top to bottom “Perception layer→Transport layer→Edge layer→Platform layer→Application layer”Each level is distinguished by different color blocks (perception layer: blue / transmission layer: green / edge layer: orange / platform layer: purple / application layer: red), and core devices are labeled at each level (such as level gauges, pressure transmitters, etc. in the perception layer). The direction of data flow is indicated by dashed lines with arrows (data collection in the perception layer→encrypted transmission in the transmission layer→local computation in the edge layer→multi terminal synchronization in the platform layer→output analysis report in the application layer). A legend is added at the bottom to explain the meaning of the color blocks and arrows, visually presenting the collaborative logic of the entire link.
- Perception layer: level gauge, pressure transmitter, flow meter, temperature sensor, electrical parameter module (covering voltage, current, power, and electricity), accurately capturing data from the entire chain.
- Transport layer: support 4G/5GEthernetWi-Fi, LoRa Ad hoc network, using MQTT+TLS Encrypt transmission and cache when disconnected from the network 7 Sky data.
- Edge layer: Built in intelligent frequency conversion cabinet PLCIndependently completed PID Constant pressure calculation, pump unit rotation, fault protection, and autonomous operation even in a disconnected state.
- Platform layer:Web, APPThree terminal data synchronization of mini programs, one click generation of configuration screens, and support multi person hierarchical permission management.
- Application layer: Targeting property management, water companies, and park managers, providing core services such as energy consumption analysis, leakage assessment, and pump room health reports.
4、 Core functions

Image descriptionPresented as a circular closed-loop flowchart with center annotation “Intelligent water supply core closed-loop”The outer ring is distributed clockwise in sequence 5 Each functional node (data collection→intelligent control→fault protection→analysis and traceability→video linkage) is distinguished by icons of different shapes (data collection: square / intelligent control: rounded square / fault protection: triangle / analysis and traceability: trapezoid / video linkage: circle). Nodes are connected by solid lines with directions, and key sub functions are labeled below each node (such as data collection “bottom labeling” multi-source data fusion (liquid level “flow rate / pressure / electrical parameters) / Fault protection”, “Annotate below” Stop the pump due to water shortage “Overpressure shut-off valve / Four channel alarm / )The outer side of the closed loop is marked with a dashed line”Continuous operation “24h Reflect the continuity and synergy of functionality.”Multi source data fusion
- The liquid level of the pool (
- , accuracy0–5m), instantaneous flow rate ( ±1cm, accuracy0–200m³/h), pipeline pressure ( ±0.5%, accuracy0–2.5MPa), and data collection have no blind spots. ±0.2%Electrical parameters
- Refresh once, real-time calculation of energy efficiency ratio 1s Provide direct basis for energy-saving assessment. kWh/m³Fully closed-loop constant voltage control
- The target pressure can be achieved through a panel or remotely
- Adjustment, 1s Self tuning, steady-state errorPID The pressure at the water end is stable.≤±0.01MPasupport
- One to many “Pump set (main” backup2 main 1 backup), start first, stop first, and rotate evenly. If a single pump runs continuously for too long, it will automatically take turns off to avoid excessive losses. / 3 Multiple protection strategies 2 Inlet water shortage: liquid level below lower limit
- Automatic pump stop, push
- Water shortage alarm 30s To prevent dry pumping from burning out the motor. “Overpressure of water outlet: the pressure continues to exceed the upper limit”Reduce pumps one by one, in extreme cases
- Quickly close the outlet electric valve to protect the pipeline network from bursting. 5s Electrical faults: Short circuit, overcurrent, overvoltage, undervoltage, phase loss, overheating are all caused by hardware 0.2s Double judgment of software, passed
- Alarm through WeChat, SMS, and phone channels. + Dual ledger of energy consumption and leakage APPAlarm through WeChat, SMS, and phone channels.
- Dual ledger of energy consumption and leakage
- Automatically generate energy efficiency curves every hour, resulting in a sudden decrease in traffic 30% When the current remains constant, mark it “Suspected leakage” And issue a warning.
- Built in water balance model, comparing the data of the same period yesterday and last week, the abnormal interval is highlighted in red to assist in quickly locating the location of the broken pipe.
- Event tracing
- All start stop, pressure adjustment, alarm, and manual intervention records come with timestamps and operator accounts, and support one click export ExcelConvenient for reconciliation and accounting.
- Video linkage
- Connect to the network camera and automatically capture the alarm moment 10s Short videos clearly show situations such as flooded pump rooms and illegal trespassing.
- Support pan tilt remote control, zoom to check for water seepage and abnormal noise in bearings and bases, and perform remote visual inspection.
5、 Typical scenarios and benefit estimation
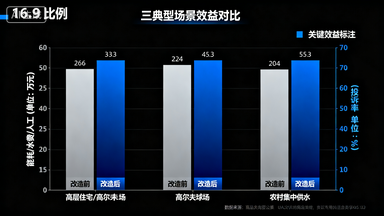
Image descriptionUsing grouped bar charts, horizontally X The axis is 3 Typical scenarios (high-rise residential buildings / golf courses / rural centralized water supply), divided into each scenario “Before renovation”“After renovation” 2 Column assembly; longitudinal Y The axis is divided into left and right dual axes, with the left axis being “Energy consumption / charge for water / Labor (unit: 10000 yuan)”The right axis is “Complaint rate (unit:%)”. Column color differentiation (pre renovation: light gray / post renovation: dark blue), with specific values marked above each column (such as high-rise residential buildings “pre renovation energy consumption” column labeling “9.8 10000 kWh”, “post renovation energy consumption” column labeling “4.1 10000 kWh(energy-saving 58%) ”)), added to the right side of the chart “Key benefit labeling”(e.g. water conservation “reduced complaint rate 32%”“monthly cost recovery 90%”“8 ), bottom label data source (”data based on actual project operation“monthly statistics 12 ), clearly compare the core benefits before and after the renovation.”High rise residential buildings (
- households,1200 floors)33 Before renovation: power frequency pump
- Taiwan, annual power consumption 7.5kW×3 Wan 9.8 Cleaning of water tank kWhSecondly 4 Annual labor costs / Ten thousand yuan. 1.5 After renovation: variable frequency constant voltage operation (average frequency
- ), annual power consumption 38HzWan 4.1 (Energy saving) kWh(Energy saving) 58%); Cancel the water tank without secondary pollution, and the water quality complaint is 0Remote duty province 1 Night shift, annual labor saving 4 Ten thousand yuan; Comprehensive annual provincial budget 7 Ten thousand yuan,8 Recovery of investment within one month.
- Golf course (hole, acre)18 Green and lane scores2500 In an irrigation area, the system automatically plans the pump output based on soil moisture and meteorological station evaporation.
- Water saving compared to traditional timing control 12 Annual water fee savings
- Field, indirect benefits 32%Ten thousand yuan. 18 Ten thousand yuan; Lawn quality improvement, increased competition schedule 3 Rural centralized water supply (Rencun Town) 60 Depth of water source well
- Originally, a dedicated person was needed to be stationed for starting and stopping, but frequent water outages occurred at night.5000 Implemented after renovation
- Low water level 180mAutomatic pump start
- Stop the pump when the water is full “, mobile phone→The water supply guarantee rate has been increased to→6、 Implementation steps”On site survey: Measure the size, diameter, and power capacity of the original pump room, evaluate the need for capacity expansion or replacement of check valves. APP Real time monitoring, villagers scan codes to pay; The complaint rate has decreased 90%Sensor deployment: The liquid level gauge is installed at the top of the water tank, with the pump outlet and the farthest end set separately 98%.
Only pressure gauges and flow meters are selected as plug-in non cutting models.
- Edge cabinet installation: supports wall mounted or floor mounted installation, rain and dust resistant design, reserved
- Redundancy facilitates later expansion. 1 Platform configuration: Import pump room photos,
- Strategy debugging: First manually test the start and stop of a single pump, confirm that the steering and pressure gauge data are correct, then put it into automatic mode and observe 30% I/O Pressure curve.
- Training delivery: Provide operation manuals and emergency procedures, establish10min Generate configuration screen; Set alarm thresholds for pressure, liquid level, current, etc.
- Duty WeChat group, front 24h Monthly push of daily operational reports.
- Operation and maintenance follow-up: remote calibration of sensors every quarter, annual cleaning of liquid level gauges, inspection of check valves, equipment lifespan can be extended 24h Above. 1 7、 Frequently asked questions and answers
- What should I do if there is a power outage? 30% Standard configuration
, optional
Q1City power interruption
UPS Alarm and remind the property to start the diesel generator to ensure uninterrupted water supply. 1kVA/1hDoes poor network signal affect water supply? 3h Lithium battery pack; Simultaneously push “The edge cabinet can operate completely off grid, and all protection logic is managed locally” Is it troublesome to add pumps or pressure zones in the later stage?
Q2The new pump connection can be completed.
Will the energy-saving effect decrease year by year? PLC Independently completed; Automatically transmit data after network recovery to ensure platform data integrity.
Q3The platform will compare the energy efficiency data of the same period, if
I/O Both the frequency converter and the inverter are designed modularly and support slot based expansion; The software can copy the parameters of the original pump set,30min Rising year by year, will prompt
Q4Pump efficiency decreases
It is recommended to perform bearing maintenance or impeller cleaning to ensure long-term energy-saving effects. kWh/m³ 8、 Future prospects “With the dual control of carbon emissions and the tightening of the red line for total water consumption, pump rooms will become”Energy
Water resources
Dual control core nodes. Deep integration of system planning “Load forecasting technology, combined with historical water usage curves, weather, and holiday information, to advance + Predict flow rate, automatically adjust pump operation time and quantity, peak shaving and valley filling to reduce maximum electricity demand. Simultaneously open” Interface, connect with the water revenue system and urban management big data platform, provide a unified data base for leakage control, zoning measurement, and tiered water pricing, so that every drop of water and every kilowatt hour of electricity can be traced and based on evidence, and promote the development of the water supply industry AI Intelligent, low-carbon, and unmanned 24h Predict flow rate, automatically adjust pump operation time and quantity, peak shaving and valley filling to reduce maximum electricity demand. Simultaneously open API Interface, connect with the water revenue system and urban management big data platform, provide a unified data base for leakage control, zoning measurement, and tiered water pricing, so that every drop of water and every kilowatt hour of electricity can be traced and based on evidence, promoting the water supply industry to “Intelligent, low-carbon, and unmanned” Comprehensive upgrade.


Leave a Reply