

1.6 Curve and Historical Curve Controls
This section mainly introduces the common applications of curve controls and historical curve controls in the Modbus protocol. Simple controls can be bound to variables, which can be associated on the configuration page or bound to variables in [Tools - Protocol and Variables - Logic Processing]
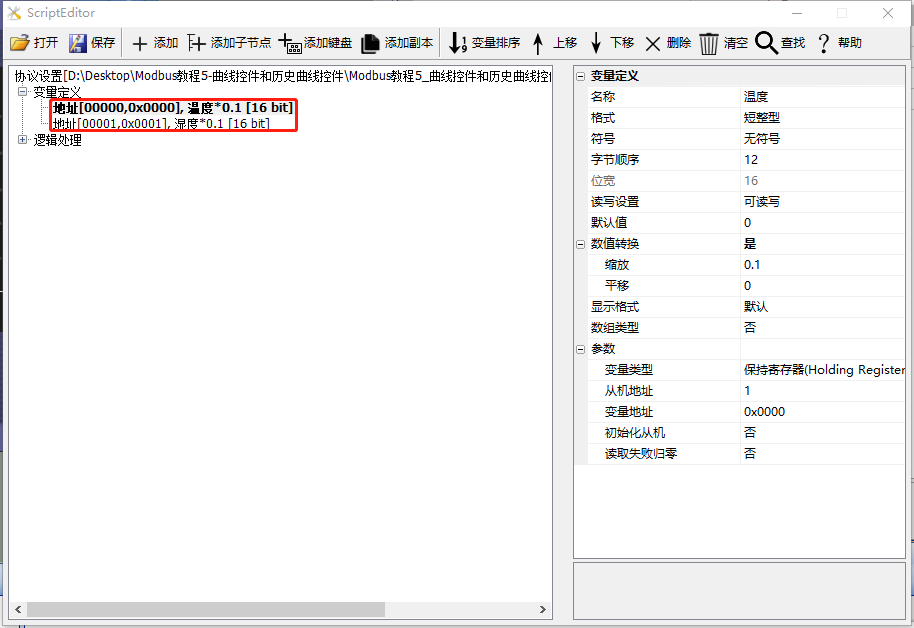
This section uses the screen as the master station to read and write slave instructions. If the screen is acting as a slave, the application of curve controls and historical curve controls is the same, and reference can be made. This section creates two save registers to illustrate the application of curves and historical curves, as shown below
Example routine download link:"Modbus Tutorial - 5 - Curve and Historical Curve Controls V1.0"
For protocol startup and variable-related instructions, refer to the link: "Modbus Basic Parameter Description"
1.6.1 Curve Control
The [Curve Control] interface primarily provides demonstrations on the usage of curve controls. In the MODBUS protocol version, the curve control is utilized to display associated variables. The curve control periodically samples variable values and then plots all the sampled values within the curve control, connecting them to form a curve. Each channel of the curve control can be associated with one variable, and up to 8 channels can be set
Screen/Logic Configuration
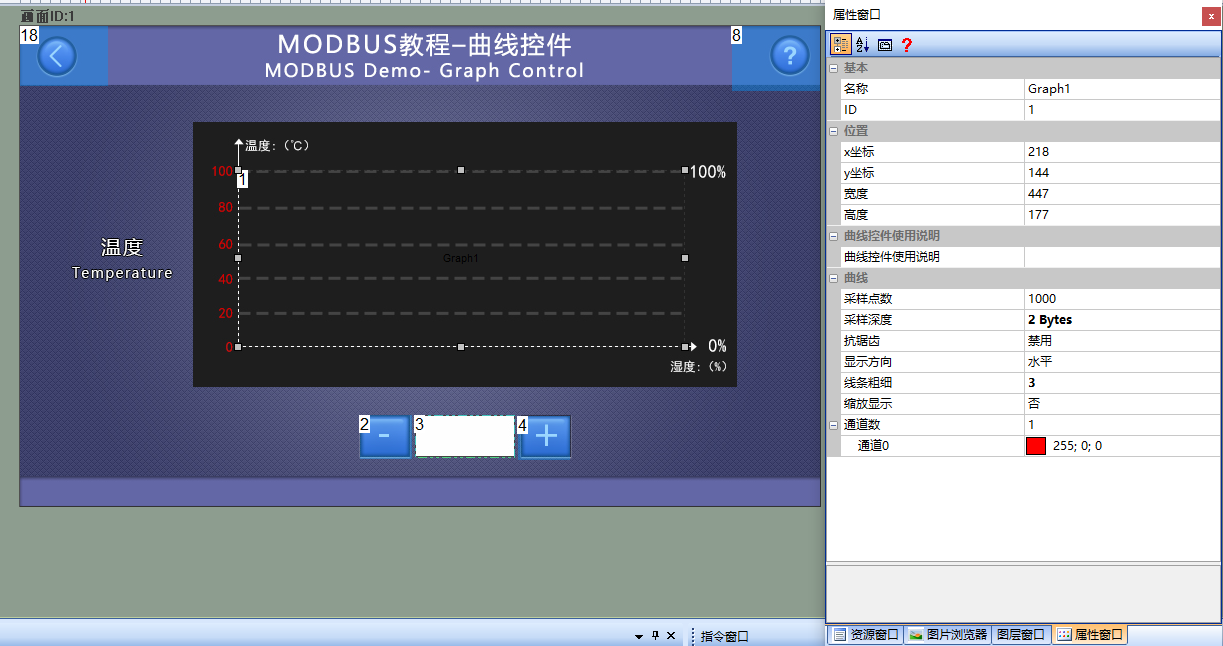
Add a curve control (ID: 1) to the screen to display the "temperature" value of the slave. Also add two button controls (ID: 2 and 4) as controls for increasing and decreasing the "temperature" variable, and add a text control (ID: 3) directly bound to "temperature" for numerical display. The relevant parameter configuration for the curve control is as follows
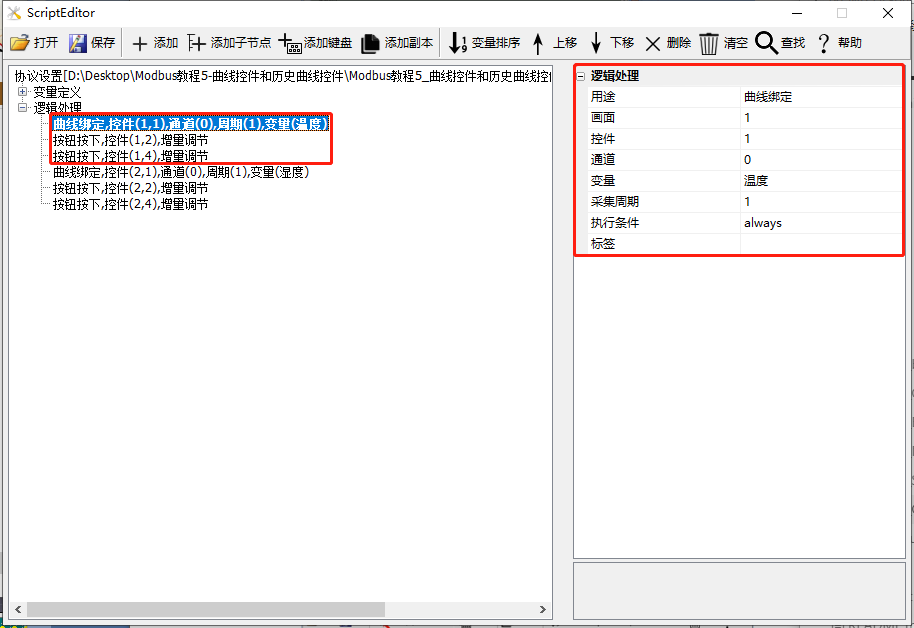
Add three logic processes in [Protocol and Variable Settings]:
The first one: Purpose is "Curve Binding", Screen is "1"; Control is "1"; Channel is "0", Variable is "temperature"; Acquisition period is "1"
Article 2: Control the increase or decrease of "temperature". The purpose is for [button press]. Fill in the screen ID as 1 and the control ID as 2. The execution action is [incremental adjustment], the variable is [temperature], the adjustment step size is [1], and the adjustment method is [decremental]. The adjustment is cycled from 0 to 100
Article 3: Control the increment of "temperature". The purpose is for [button press], with the screen ID filled in as 1 and the control ID as 4; the execution action is [incremental adjustment], with the variable being [temperature], the adjustment step size being [1], and the adjustment method being [incremental]; the adjustment is cycled from 0 to 100.
Run preview.
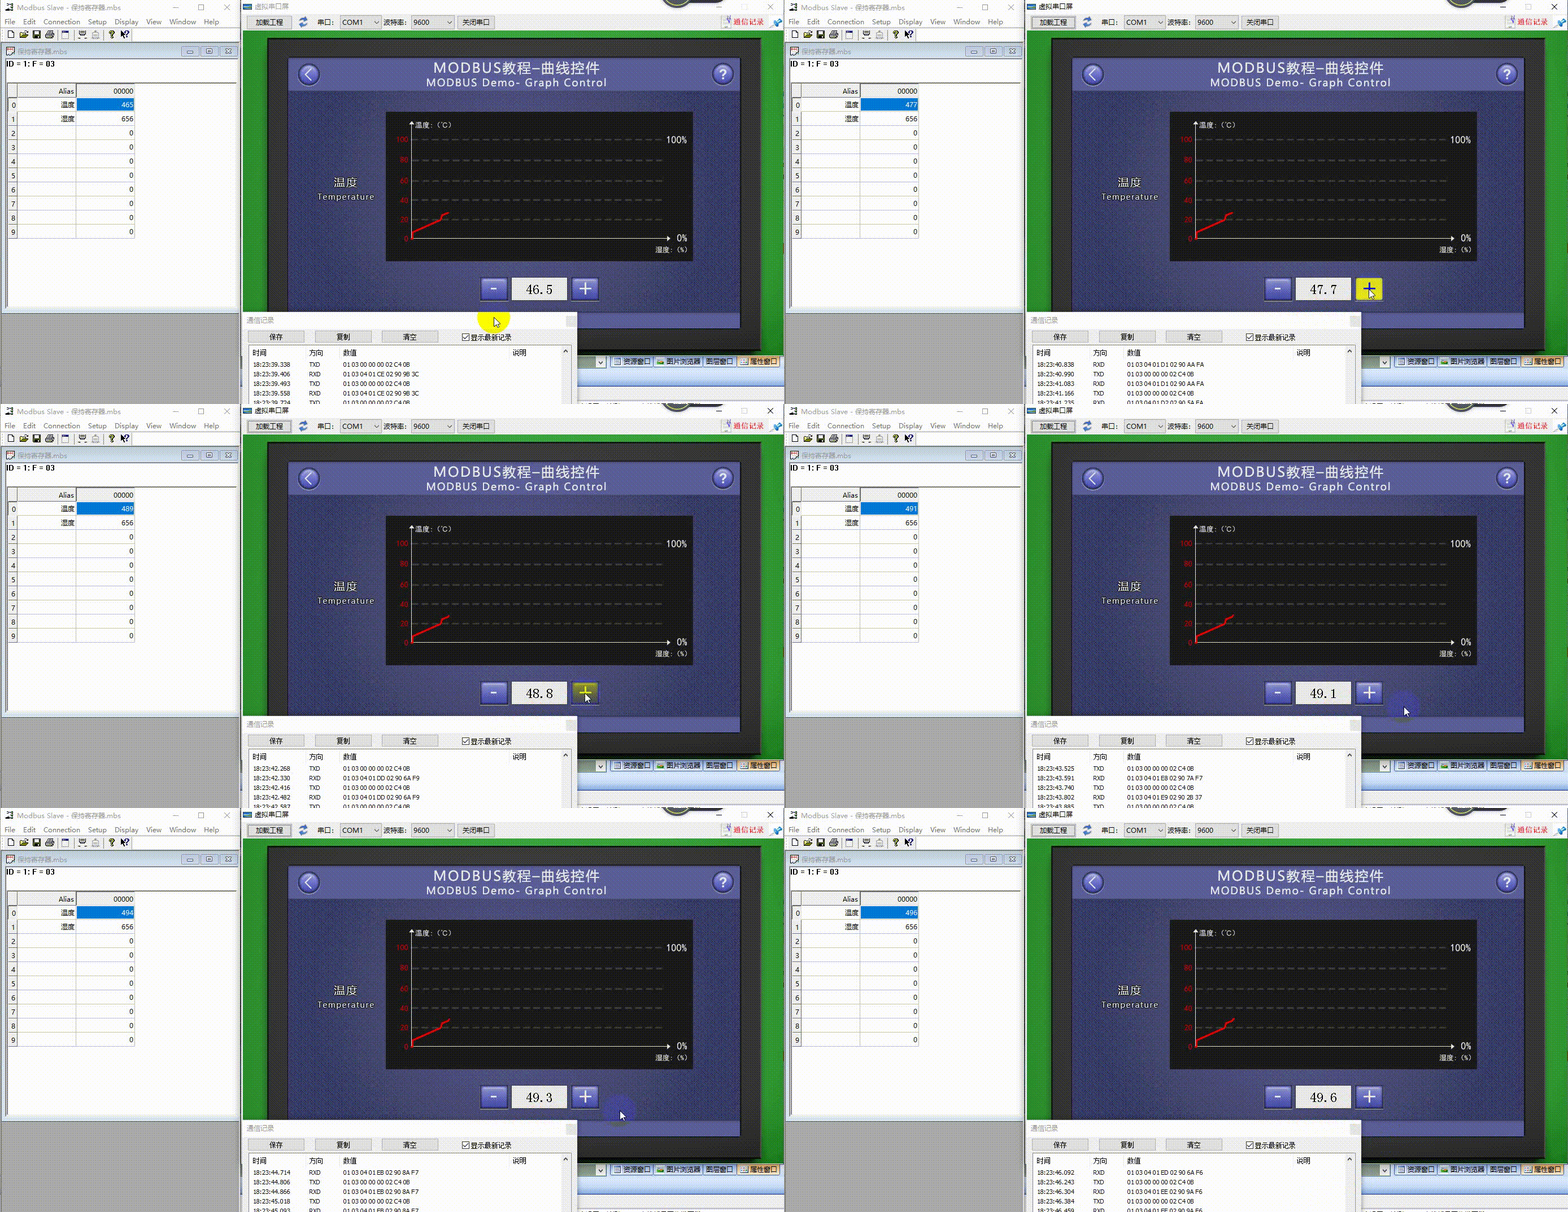
At this time, compile the project and download it to the serial port screen. Connect it with the MODBUS Slave software, and the curve control will display the real-time changes in temperature. Pressing the button controls (ID: 2 and ID: 4) simultaneously can control the "temperature" variable, and the display of the curve control will also change accordingly, as shown below.
1.6.2 Historical curve control.
The [Historical Curve Control] interface primarily provides an example of how to use the historical curve control. Both the historical curve control and the curve control can sample and display the bound variable values in real time. The difference lies in that the historical curve control stores previous data, allowing users to view historical data. In the MODBUS protocol version, the historical curve control is used to display associated variable values. The historical curve control periodically samples variable values, then plots all the sampled values into the historical curve control to connect and form a curve. Each channel of the historical curve control can be associated with a variable, and up to 8 channels can be set.
Screen/logic configuration.
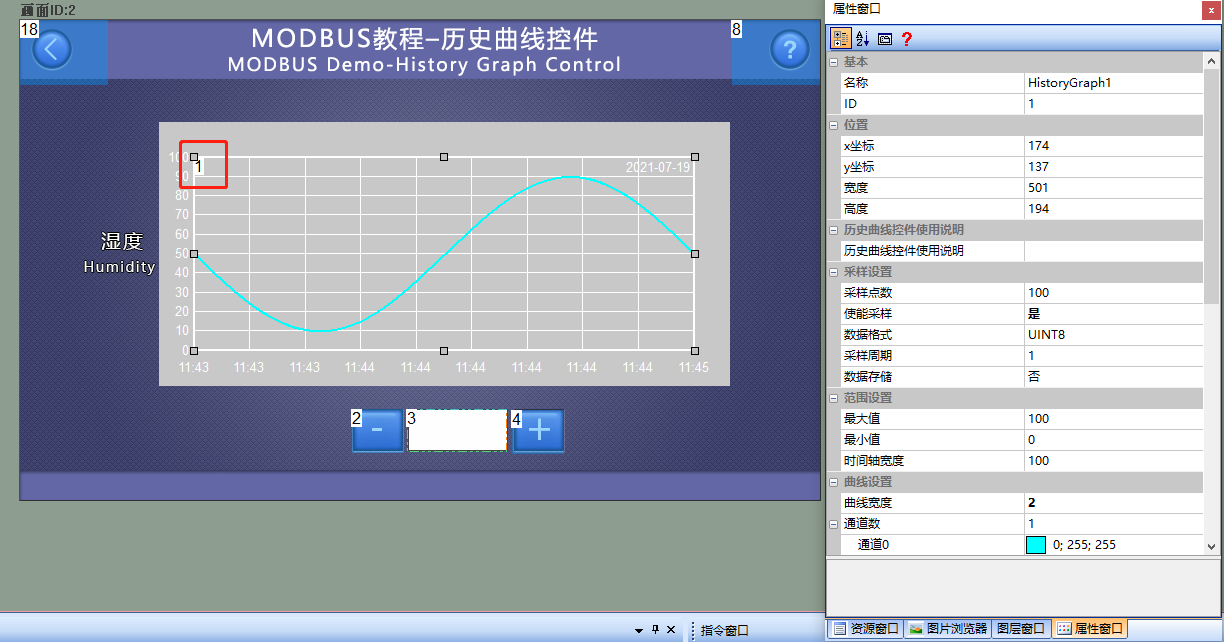
Add a historical curve control (ID: 1) to the screen as a display for the "humidity" value of the slave device. Also add two button controls (ID: 2 and 4) as controls for increasing and decreasing the "humidity" variable; and add a text control (ID: 3) directly bound to the "humidity" variable as a numerical display. The relevant parameter configuration of the historical curve control is as follows:
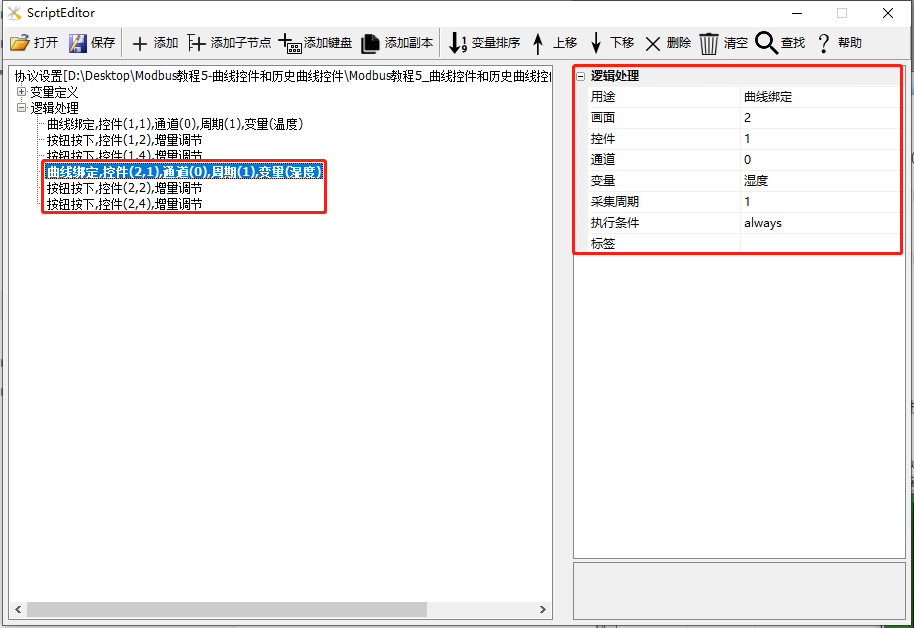
Add three logical processes in [Protocol and Variable Settings]:
Item 1: Purpose: "Curve binding". Screen: "2"; Control: "1";
Article 2: Control the increase or decrease of "humidity". The purpose is [button press], the filling screen ID is 2, and the control ID is 2; the execution action is [increment adjustment], the variable is [humidity], the adjustment step length is [1], and the adjustment method is [decrease]; the adjustment is cycled from 0 to 100
Article 3: Control the increment of "humidity". The purpose is for [button press], with the screen ID filled in as 2 and the control ID as 4; the execution action is [incremental adjustment], the variable is [humidity], the adjustment step size is [1], and the adjustment method is [incremental]; the adjustment cycles from 0 to 100.
Run Preview
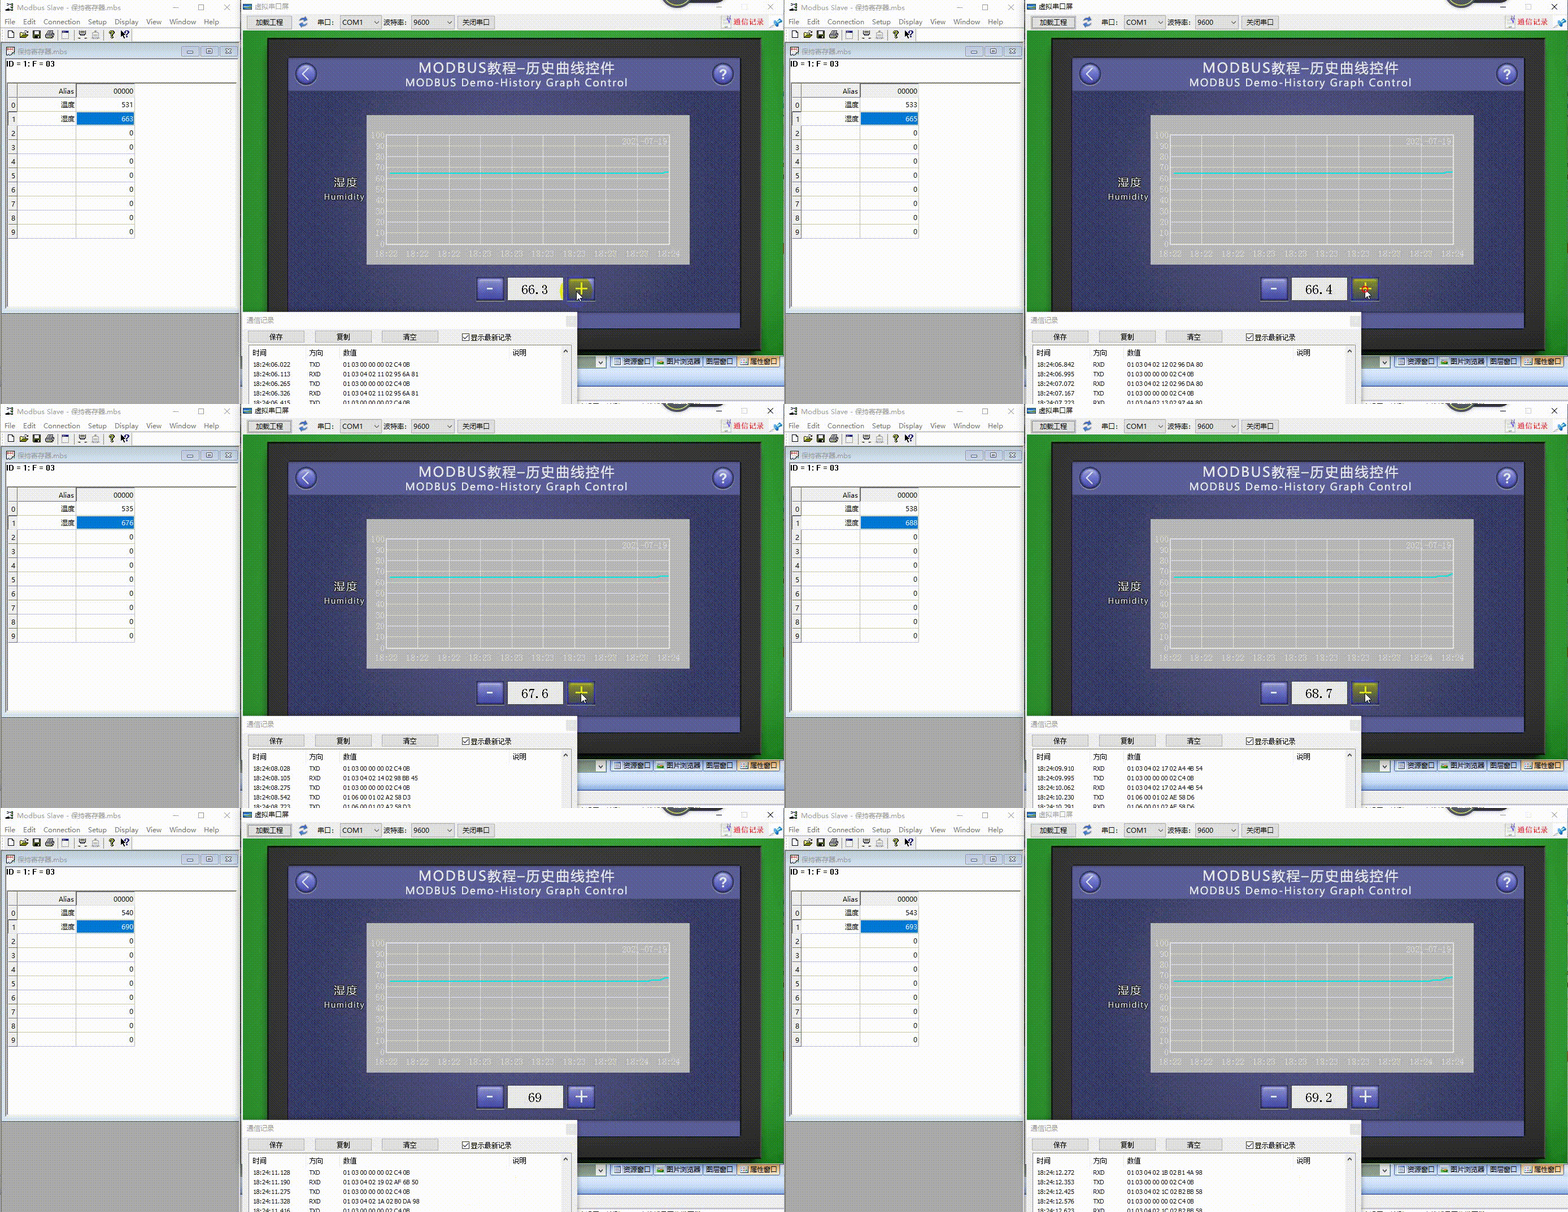
At this point, compile the project and download it to the serial port display. Connect it to the MODBUS Slave software, and the historical curve control will display the real-time changes in humidity. When the number of sampling points displayed on the screen exceeds the set value (default is 100), you can view historical data by using the scroll bar above the historical curve control. Pressing the button controls (ID: 2 and ID: 4) simultaneously allows you to control the "humidity" variable, and the display of the historical curve control will change accordingly


Leave a Reply