
The data recording control is a tool specifically designed for alarm/event recording in the Da Cai serial port screen. In Modbus engineering, it displays the alarm status from the slave machines (PLC, frequency converter, temperature control module) on the screen in chronological order. This tutorial covers the complete process from protocol configuration, variable creation to screen debugging, with a focus onThe two most common ways to record eventsSeparate and explain clearly to avoid mismatches that may cause the screen to not display or remember. The document is compiled from "MODBUS Tutorial Data Recording Control V1.0" by Guangzhou Dacai Optoelectronic Technology Co., Ltd., and the copyright belongs to Dacai.
1 Scope of application and development environment
This document is applicable to Da CaiAll serial screen products that support Modbus protocolBasic type, economy type, commercial type, F-type, IoT type, 86 box, 485 series. Except for the NANO series (NANO only supports the Big Color configuration protocol and does not support Modbus).
Before building the project, confirm that the version is sufficient. If the version is not sufficient, there may be strange problems during compilation or runtime. After debugging for a while, it was found that the firmware was old:
| Software/firmware | Minimum version requirement | View mode |
|---|---|---|
| VisualTFT upper computer | V3.0.0.1037 and above | Start page top right corner/software bottom right corner |
| Basic/economical/commercial firmware | MB 2.22.912.259 and above | Stickers on the back of the screen, or text controls bound with "System Variables → Firmware Version Number" |
| IoT firmware | V3.0.301.0 and above | Ditto. |
| F-type firmware | V4.1.66.0 and above | Ditto. |
The hardware verification platform for this routine isBig Color Basic 7-inch Screen DC80480B070For other sizes of serial port screens, simply follow this tutorial. VisualTFT developed by Da Cai for upper computer, official website http://www.gz-dc.com Download.
2. Basic Modbus Protocol for Serial Port Screen
All series of serial port screens of Dacai, except NANO, support two protocol versions simultaneously: Dacai configuration protocol and Modbus RTU protocol. The physical specifications of the screen's serial port are fixed as: 1 start bit/8 data bits/no checksum/1 stop bit (8N1). Baud rate range: RS232 supports 1200-921600bps (typical 115200), RS485 supports 1200-115200bps (typical 9600).
When developing Modbus projects, the variables and protocols that you have configured in VisualTFT will be solidified into the project package and downloaded to the screen after compilation. screenAs a hostPeriodically send read instructions to the slave machine according to the polling cycle you set, parse the response received from the slave machine, refresh the bound control or trigger the preset action; screenAs a subordinate machineThen respond to the polling of the external master station.
3 Modbus Protocol and Variable Configuration (Preconditions)
Open the VisualTFT menu 【 Tools 】 → 【 Protocol and Variable Settings 】, select the file path on the left, and set the protocol type in the protocol settings bar on the right. The data logging control itself does not bind specific register reads, it displays the state changes of "variables", which are mapped from Modbus registers - so the protocol and variables must be configured first.
3.1 Screen as Host/Slave Configuration Item
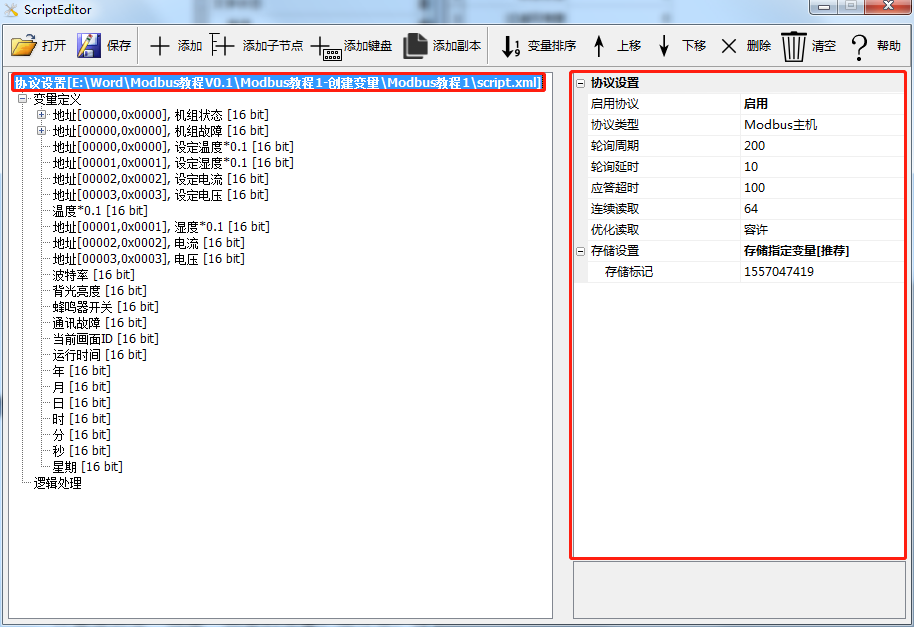
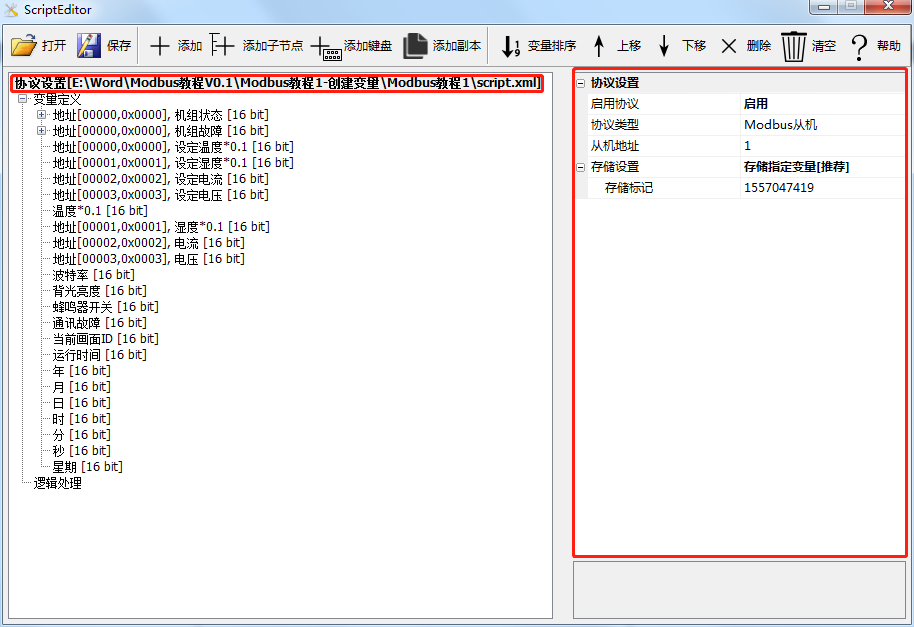
| configuration item | default value | Instructions |
|---|---|---|
| Enable Protocol | — | Must be checked to support Modbus |
| Protocol Type | — | Select 'Modbus Master' or 'Modbus Slave'; This routine is the host mode |
| slave address | 1 | Only required for slave mode, the slave address is filled separately in the variable for host mode |
| polling cycle | 1 second | Periodic interval for reading variables |
| Polling delay | 100 milliseconds | The interval between two adjacent read commands |
| Response timeout | 100 milliseconds | Allow maximum response delay for the slave |
| Continuous reading | — | Maximum number of reads at once for continuous address variables |
| Optimize reading | — | After activation, only read the variables related to the screen to save serial port bandwidth |
| Storage Settings | — | Do not store/store all/store specified variables (the latter is recommended, storing system parameters that are rarely changed) |
| Storage tags | — | The data format has been changed. Manually adjust this value to prevent reading from the old version storage |
In the storage settingsNot recommended for 'all storage'——Frequent writing to Flash will accelerate bad blocks. To save in case of power failure, select a specific variable using 'Store specified variable'. When using the screen as a slave, there are fewer configuration items: enable protocol, select "Modbus slave" protocol type, slave address (default 1), storage settings, and storage tags.
3.2 Establishing Variables
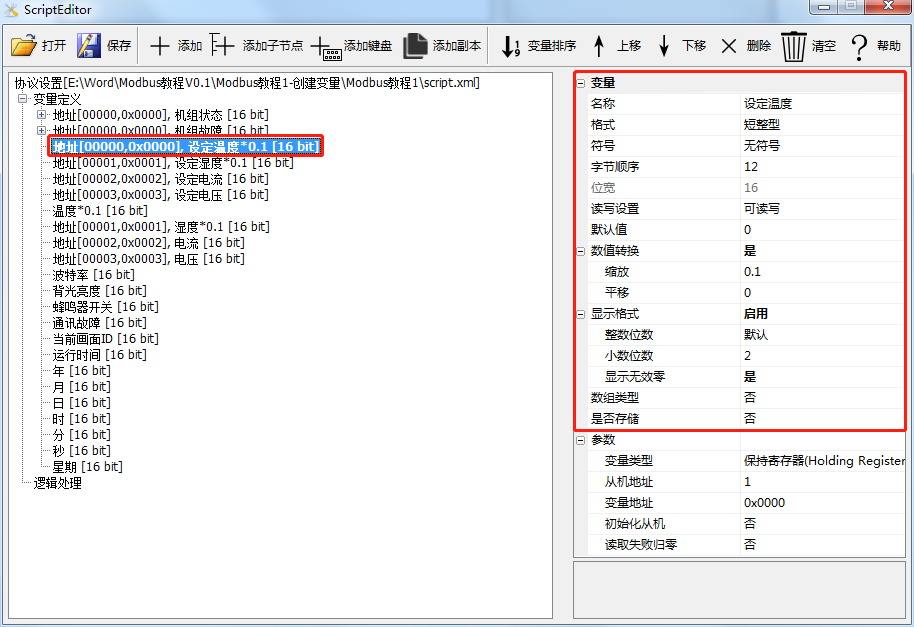
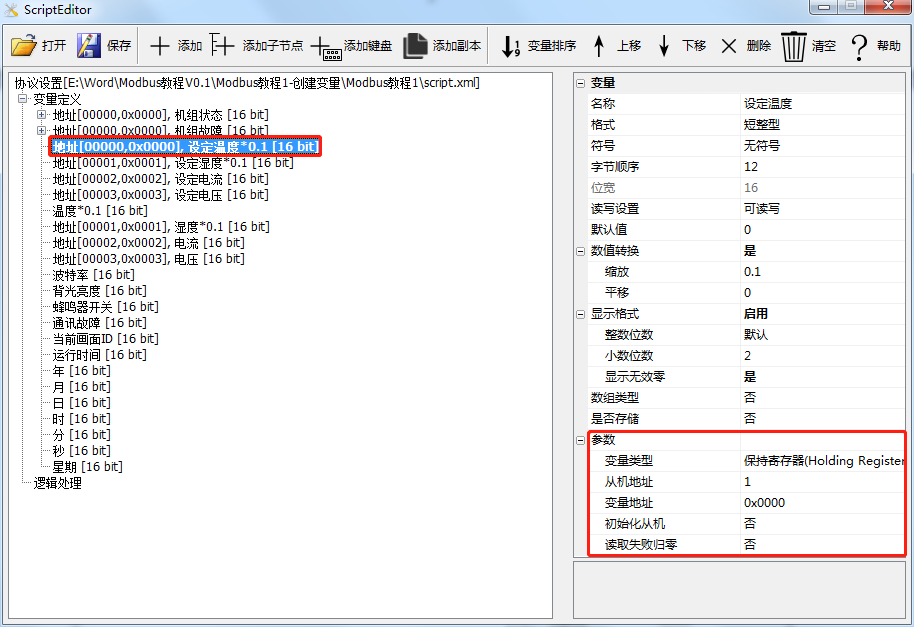
After adding the variable node, set it in the property window. Several key attributes:
| attribute | Instructions |
|---|---|
| Name | Default Variables 1/2/3... It is recommended to change them to meaningful ones, such as' Unit Status'; Segmented variables default to Field1/2/3..., can be changed to 'on/off' |
| Format/Symbol | Short integer, long integer, single precision floating-point, string; Can be set as unsigned/signed |
| Read and write settings | Read/Write/Read Only/Write Only |
| default value | Default display value |
| numerical conversion | Actual value=original value x scaling+translation, for example, converting register integers to engineering quantities with decimals at 0.1 magnification |
| Display format | Set the number of digits for integers and decimals |
| Array type | Operate N registers continuously from this address after activation |
| Is it stored | After enabling the storage settings for the protocol, check this box to save in case of power failure |
Variable parameters:Variable type support Coil, discrete input, hold register, input register, memory variable, system variable Only when the screen is used as the host, it needs to be filled in slave address And Variable address (filled in hexadecimal)'Initialize slave' means writing variable values back to the slave after power on; 'Read failed zeroing' refers to resetting the variable to zero when it cannot be read (use with caution in alarm situations, it may be displayed incorrectly).
Two Uses of Data Recording Control (Read this paragraph first, then match)
The data recording control records events generated by variable state changes. To display a certain alarm, two things need to be done:
- Alarm analysisEstablish a comparison table for "Event ID → Text/Color". The words and colors displayed on the screen are determined here.
- Event record [Trigger]Deciding when to make a note. Only when the triggering conditions are met, will a timestamp record be generated based on the text in the alarm parsing.
How to fill in the event ID and write the triggering conditions depends on your slaveWhat data is returnedIn practice, there are two usage methods that are completely different, which will be explained in layers below.
4.1 Usage 1: Bit Mapping (Register returns bitmap, requires disassembly of child nodes)
Applicable scenariosThe slave uses different bits in a register to represent different alarms, and returns a 'bitmap'. For example, create a discrete input variable 'Unit Fault' (occupying one 16 bit register), where bit0=compressor low pressure, bit1=fan fault, bit2=smoke detector alarm, and bit3=filter blockage.
Child nodes must be createdBecause this usage requires separating each individual bit as a variable, otherwise the control cannot distinguish which bit it is. Add child nodes (segmented variables) under the variable and name bit0~bit3 separately:
| Child nodes (segmented variables) | Corresponding bit | meaning |
|---|---|---|
| Field1 | bit0 | Compressor low pressure |
| Field2 | bit1 | Fan failure |
| Field3 | bit2 | Smoke alarm |
| Field4 | bit3 | Filter blockage |
Alarm analysisEvent ID fillingChild Node Number 0/1/2/3(Corresponding to bit0~bit3), and set the description and color.
Event Record [Trigger]Select variables for event parameters, select corresponding child nodes for event IDs (0/1/2/3), and write the execution condition as' this child node==1 '. For example: Event parameter=Variable/Event ID=0/Execution condition=Equal/Variable=Unit failure/Compressor low pressure/Value=1.
⚠ Note:The event ID in bit usage isChild node number (starting from 0)It is not 0001/0002 returned by the register. The corresponding register values at the bottom layer are 0x0001/0x0002/0x0004/0x0008. A 16 bit register can hold up to 16 events from bit 0 to bit 15. Event correlation occurs whenScreen sideThe control matches the register value to the sub node by bit, and then parses the alarm to retrieve the text.
4.2 Usage 2: Value Mapping (Register direct read event number, without splitting child nodes)
Applicable scenariosDirectly returning an 'event number' value from the slave, for example, reading 0x0001 indicates event one, 0x0002 indicates event two, 0x0003 indicates event three... The register holds the number itself,No need to disassemble bits, no need to create child nodes。
Do not create child nodesIn this usage, there is only one variable, and the value read back is the event number. Do not unpack.
Alarm analysisEvent ID fillingThe number value returned from the machine(such as 1, 2, 3, or corresponding hexadecimal 0001, 0002, 0003, fill in according to your actual register), and set the description and color.
Event record [Trigger] configuration (strictly follow the following 5 steps):
- Event ParametersSelect 'Variables'
- Event IDSelect the register variable set above (which is the variable that reads the number itself)
- Execution conditionsSelect 'Equal to'
- variable: Still choose this register (the same as step 2)
- numerical valueFill in the value returned by the slave (such as 1/2/3, or 0001/0002/0003, consistent with the event ID in the alarm resolution)
⚠ Note:Value mapping usage does not set child nodes, does not write 'certain bit==1'The condition is' register value==a certain number ', and after hitting it, the screen will directly display/record the time according to the text corresponding to that number in the alarm analysis. The event ID in the alarm resolution must be exactly the same as the 'value' here, otherwise the read number will not match the text, and it will not be displayed or timed on the screen.
4.3 How to choose between the two usages
| Comparison item | Usage: One bit mapping | Usage binary mapping |
|---|---|---|
| Return from machine | Bitmap (one alarm per person) | Event number values (0001/0002/0003...) |
| Do you want to create child nodes | Need to (remove bit) | Not needed |
| What is the event ID filled in | Child Node Number 0/1/2/3 | The number value returned by the register |
| Execution conditions | A child node==1 | Register==a certain number |
| Common scenarios | A fault word contains multiple switch values | The slave actively reports the event serial number |
5 Tutorial Implementation (Complete demonstration of bit usage, see 4.2 for value mapping)
The data recording control supports three types of records:Current Alarms、Historical Alarms、Historical alarms and their resolution(There is an additional time to clear each alarm compared to 'historical alarms'). This routine demonstrates the first two methods and is divided into three steps: preparing materials → implementing functions → downloading the project. Below is the complete process using the bit usage of 4.1 (as shown in the figure); If your project is a 4.2 value mapping, simply follow the 5 steps in 4.2 to modify the 'Event Record [Trigger]', and everything else remains the same.
5.1 Preparation of Engineering Materials
DC80480B070 basic 7-inch screen for hardware use; VisualTFT software is used; Use the prepared graphic design for the UI. The engineering structure adopts homepage navigation+split screen: two buttons are placed on the homepage to switch to the [Current Alarm] and [Historical Alarm] screens, and each sub screen has a return to the homepage button. In addition, there are two pure explanation screens: 'Current Alarm Description' and 'Historical Alarm Description'.
5.2 New construction project
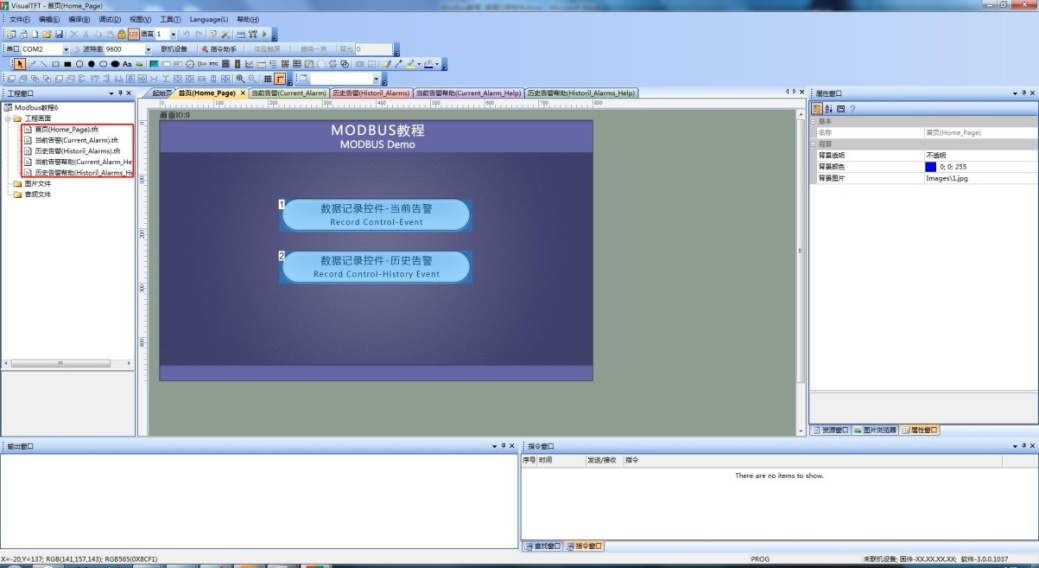
Open the menu [File] ->[New Project], and a new project window will pop up. Set the project name, path, and device type, and click [OK].
5.3 Configuring Modbus Host
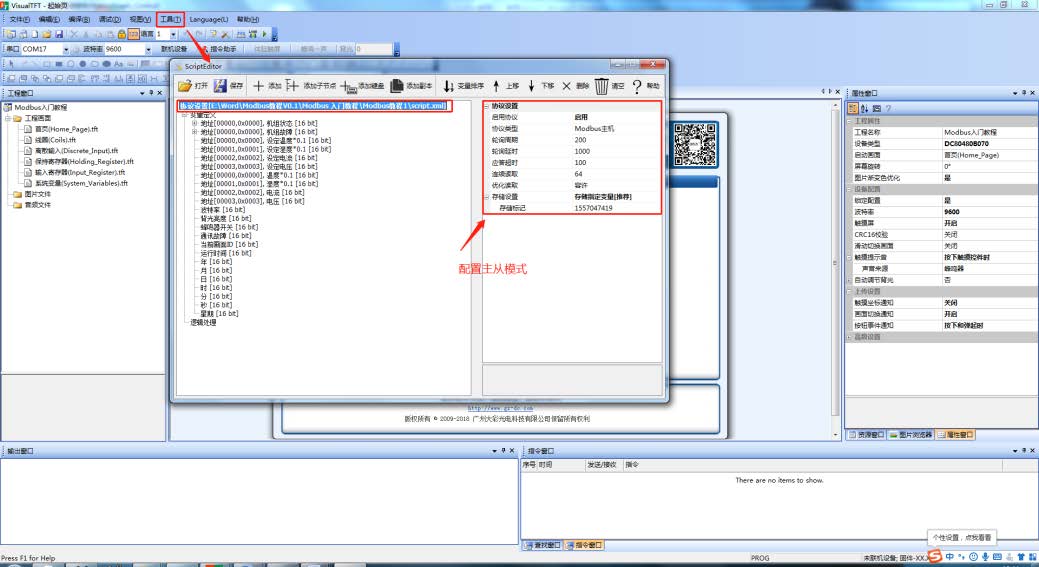
Go to 【 Tools 】 → 【 Protocol and Variable Settings 】, set the protocol type to 'Modbus Host', and follow the parameters in section 3.1. The polling cycle of 1 second, polling delay of 100ms, and response timeout of 100ms are default and generally do not need to be changed.
5.4 Screen and Control Configuration
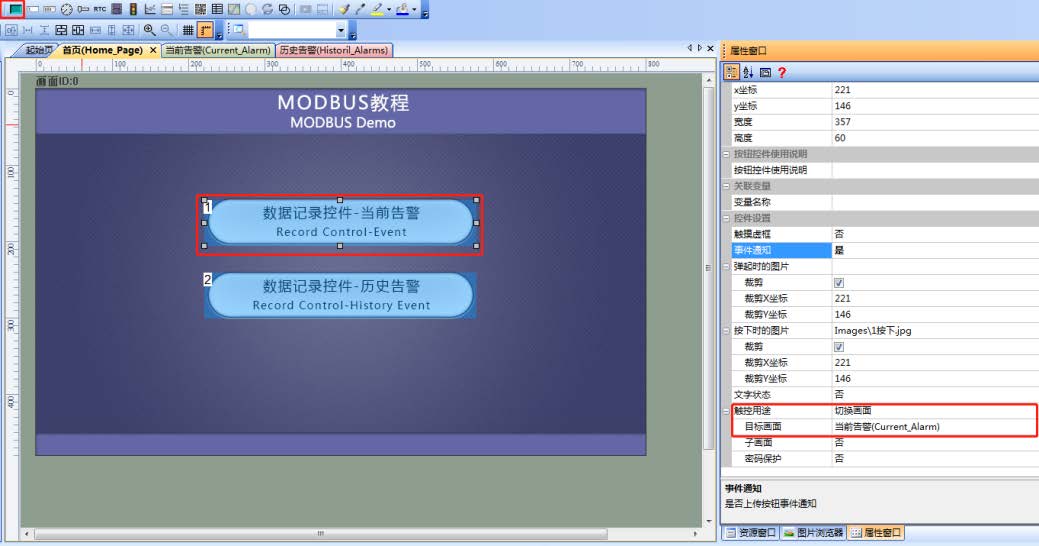
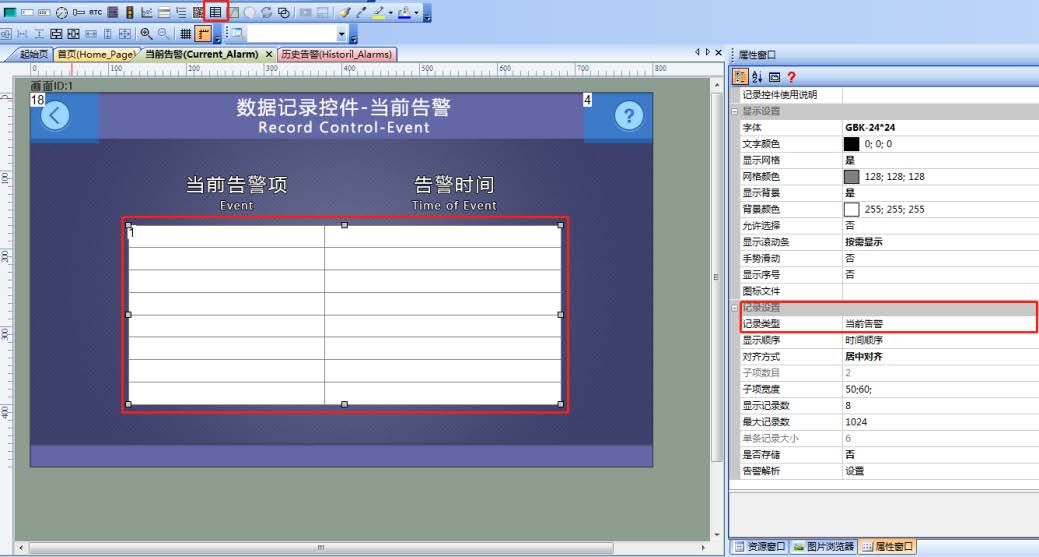
On the homepage, there are two buttons (Control ID: 1) with touch type "Switch Screen". The target screens respectively refer to "Current Alarm" and "Historical Alarm". Set the touch type to "Switch Screen" and select "Current Alarm" as the target screen in the button properties, and the same applies to the other option.
5.5 Current alarm screen
When the slave generates an alarm, the data recording control displaysCurrentThe alarm and triggering time; After the alarm is cleared, the control will no longer display this item. Configuration steps:
- Add a data recording control (Control ID: 1) to the screen and set the 'Record Type' toCurrent Alarms;
- Set the numerical value, display color, and description of each event ID in "Alarm Analysis";
- For each event ID, add a logical process with the purpose of "Event Record [Trigger]", and set the execution condition to either the bit==1 (bit usage) or the register value==number (value mapping, see 4.2).

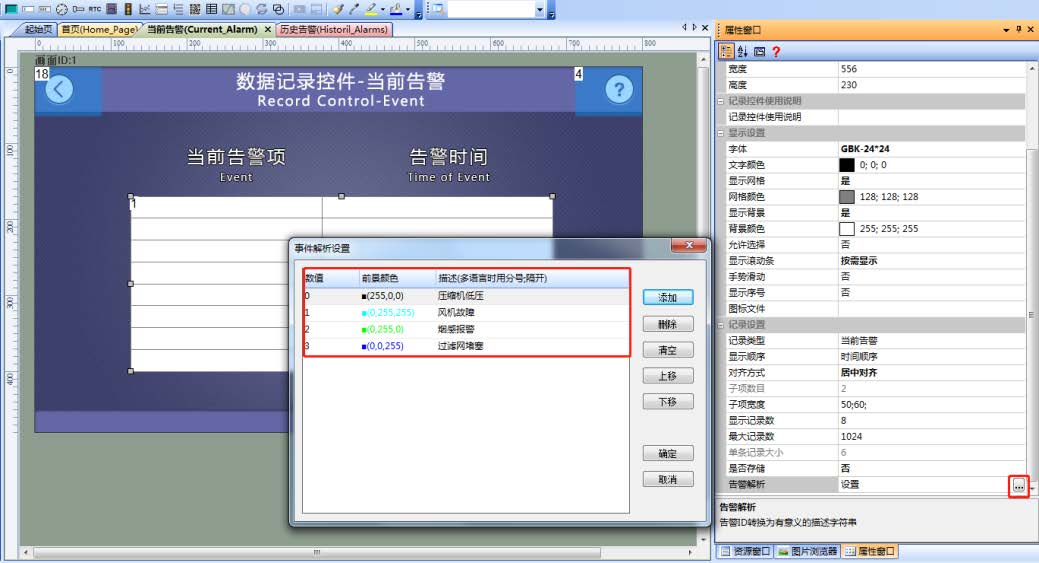
The "Alarm Resolution" dialog box has three columns: Event ID (numerical value), foreground color, and description. In this example, using bit usage, the discrete input variable 'Unit Fault' is created with the first 4 digits, and the event ID is filled with the sub node number0=low pressure of compressor, 1=fan failure, 2=smoke alarm, 3=clogged filter screenThe colors in the current alarm are distinguished by severity, such as compressor low pressure red, fan/smoke detector green, and filter blue.
Each event ID corresponds to a 'Event Record __MBI6_' logic. The usage and writing style of bit is as follows:事件记录[触发] / control(1,1) / event(0) / 条件(机组故障/压缩机低压 == 1)When the value is 1, an alarm record is triggered. The four events are event 0 (compressor low pressure), event 1 (fan failure), event 2 (smoke alarm), and event 3 (filter blockage) - the event ID must match the value filled in the "alarm analysis" one by one.
If you are using a 4.2 value mapping, follow the 5 steps in 4.2: Event parameter=Variable/Event ID=That register/Execution condition=Equal/Variable=Same register/Value=Return number (such as 1).
5.6 Historical Alarm Screen
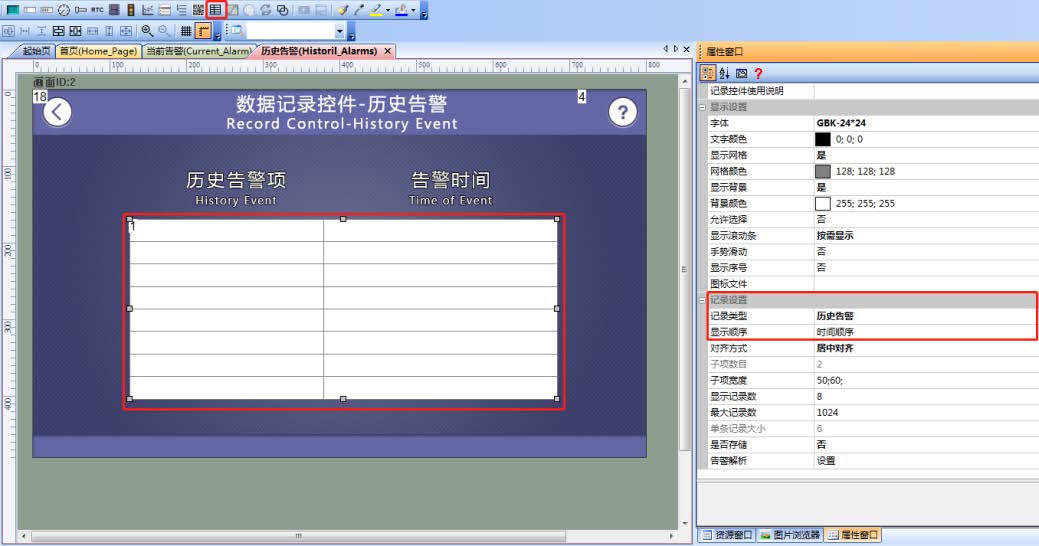
The configuration of historical alarms is almost the same as that of current alarms, with the only difference being the selection of record typesHistorical AlarmsDifference: After the alarm is cleared, this record of historical alarmsStill remain in the tableIf the storage setting is enabled in the Modbus protocol, it can still save when powered off and not lose when powered on again.

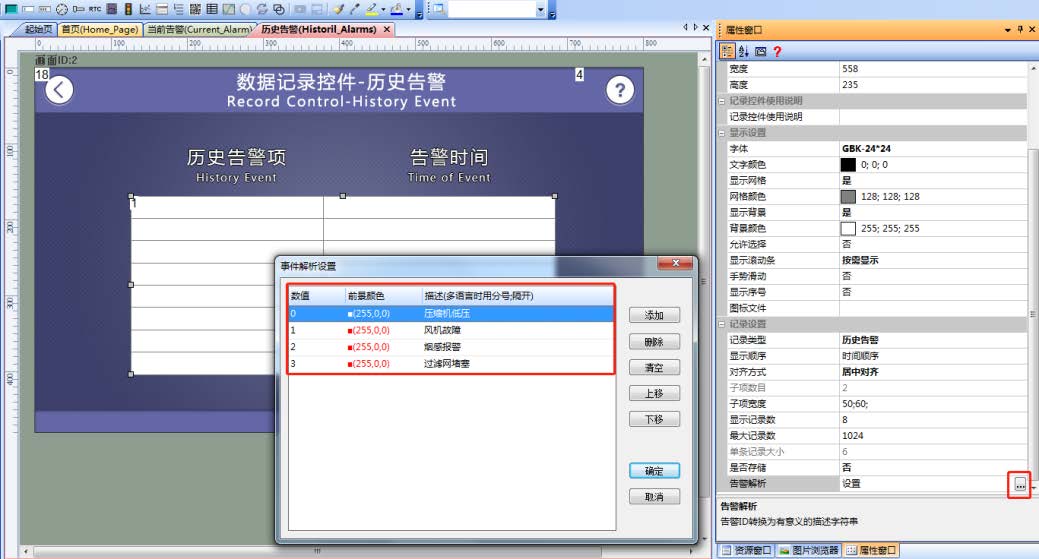
The logic of "alarm analysis" and "event record [Trigger]" for historical alarms is completely symmetrical to the current alarm, except that the control points to screen 2, and the four colors in the alarm analysis are uniformly set to red (255,0,0), emphasizing "leaving a trace when it has occurred". The event ID also starts from 0 and corresponds to the child node number (bit usage), and the logic also needs to write the condition of "everyone==1"; The usage of value mapping is described in section 4.2.
5.7 Run Preview
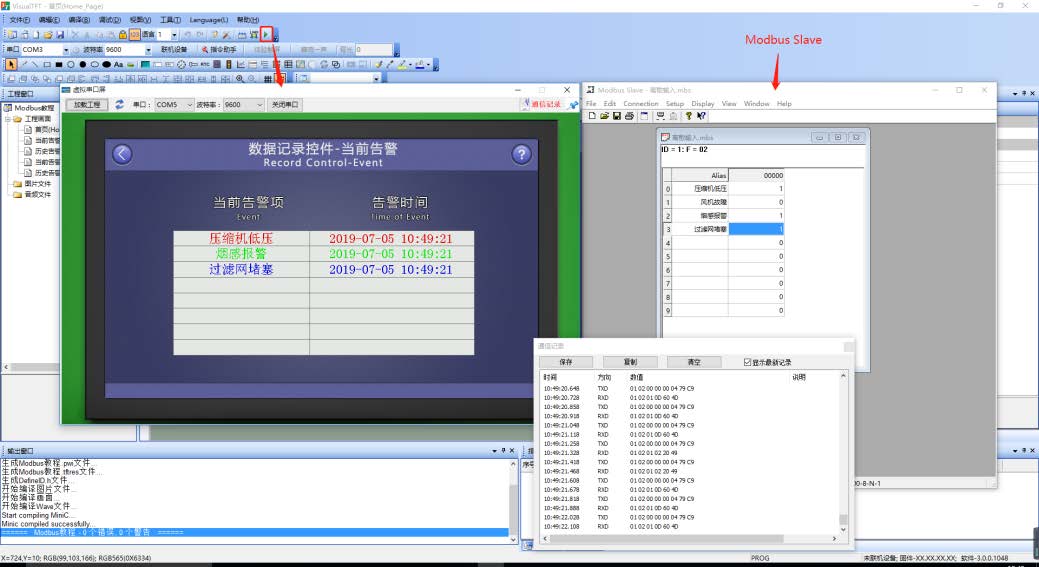
This routine is used as a host for the screenModbus SlaveSoftware simulation of slave response. Run the virtual screen and connect it to Modbus Slave to see the effect: the current alarm screen lists active alarms (compressor low pressure, smoke alarm, filter blockage) and their triggering times, and the Modbus Slave on the right displays the corresponding register values and communication logs. For specific operations, please refer to the "MODBUS Serial Port Screen Application Document_V1.0. pdf" by Da Cai.
6 Download Project
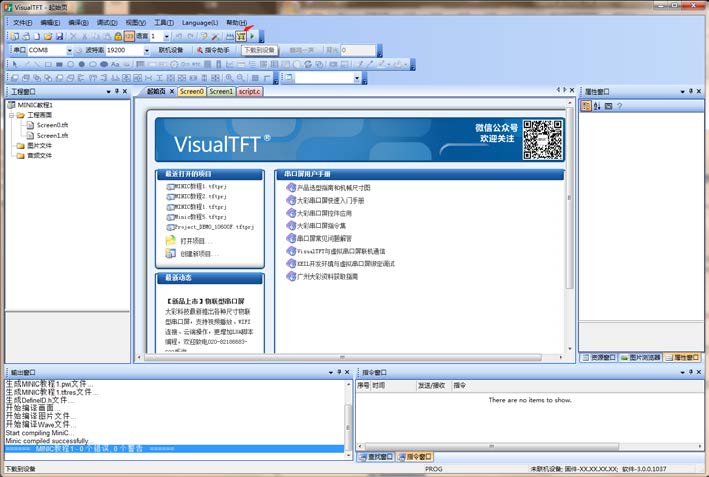
After successful compilation of VisualTFT, the output window will prompt "Compilation successful", and then it will be displayed on the screen in two ways:
- USB DownloadClick on the 'Download to Device' menu and use a USB cable to download the configuration to the screen;
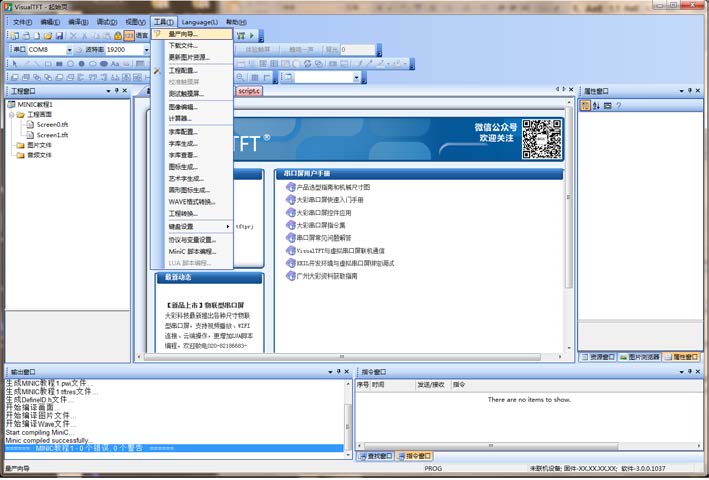
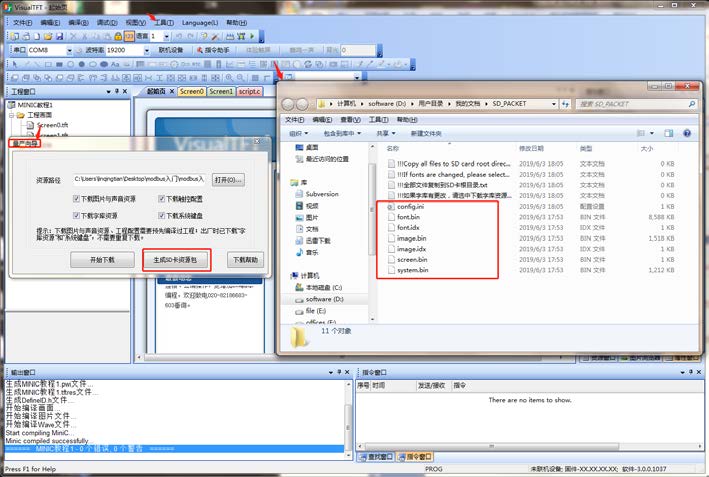
- SD card download: Menu [Tools] → [Production Wizard] → Select "SD Card Download", copy all files in the pop-up window to the root directory of the SD card, insert the screen, power on again, and remove the SD card after burning.
7 Key points of engineering practice (pitfalls warning)
- First determine the usage, then matchIs the slave returning a bitmap (bit usage, to split child nodes) or an event number (value mapping, not to split child nodes)? The two methods are completely different, mixing them will not display on the screen.
- Usage of bit: Event ID=Child Node Number 0/1/2/3Corresponding to register values 0x0001/0x0002/0x0004/0x0008. Do not enter 'register returns 0001/0002/0003' as the number in the event ID -0003 is a combination of bit0 and bit1, not 'event 3'.
- Usage of value mapping: Do not create child nodes, do not write 'certain bit==1'Event record [Trigger] follows the 5 steps of 4.2: Event parameter=Variable → Event ID=Which register → Execution condition=Equal → Variable=Same register → Value=Return number. The event ID in the alarm resolution must be exactly the same as the value here.
- Event IDs must be alignedThe ID filled in the "Alarm Resolution" and the event ID (or value) in the "Event Record __MBI10_" logic are the same thing. If they do not match, the alarm will not be displayed on the screen.
- Logical necessary conditionIf the execution condition is not written in the 'Event Record [Trigger]', it will trigger unconditionally, and all events will be recorded, resulting in a messy screen.
- Historical alarms need to be saved in case of power failure, remember to turn on the storageOnly when the "Store Settings=Store Specific Variables" option is enabled in the Modbus protocol configuration and the "Store" option is checked in the variable properties, the historical alarm will not be lost after power failure. Both locations must be set up, only one location will not take effect.
- The semantics of current alarms vs. historical alarmsThe current alarm is' active '- it disappears upon release; Historical alarms are 'accounting' - even when resolved, they leave a trace. When selecting, think carefully whether you want real-time status or audit records.
- Don't be too harsh on the polling cycleIf the slave response is slow or there are many bus devices, the 1-second polling+100ms delay should be appropriately amplified, otherwise there may be timeout and alarm jump when reading halfway.
- Color ID is meaningfulThe current alarm uses different foreground colors (red/green/blue) according to severity, and historical alarms are uniformly red - do not fill in randomly, otherwise it will not be distinguishable on the screen.
Compiled from "MODBUS Tutorial Data Recording Control V1.0" by Guangzhou Dacai Optoelectronic Technology Co., Ltd. (www.gz-dc. com), the copyright belongs to Dacai. For details on online debugging, please refer to Da Cai's "MODBUS Serial Screen Application Document_V1.0. pdf".


Leave a Reply