
What is the historical curve control?
The historical curve control is used to record the change path and curve of certain data over a period of time. This routine introduces common applications of the historical curve control, and describes the configuration of each application in conjunction with the screen in engineering. Common applications are as follows:
- Recording temperature changes over a period of time, where the external MCU sends temperature data collected by sensors to the screen, and displays it on the screen using the historical curve control.
Scope of application: full series.
Routine download link: "Historical Curve Control Application"] (click to jump)
14.1 Historical Curve Attributes
This section focuses on the attributes of the historical curve control. The attribute window is as follows:
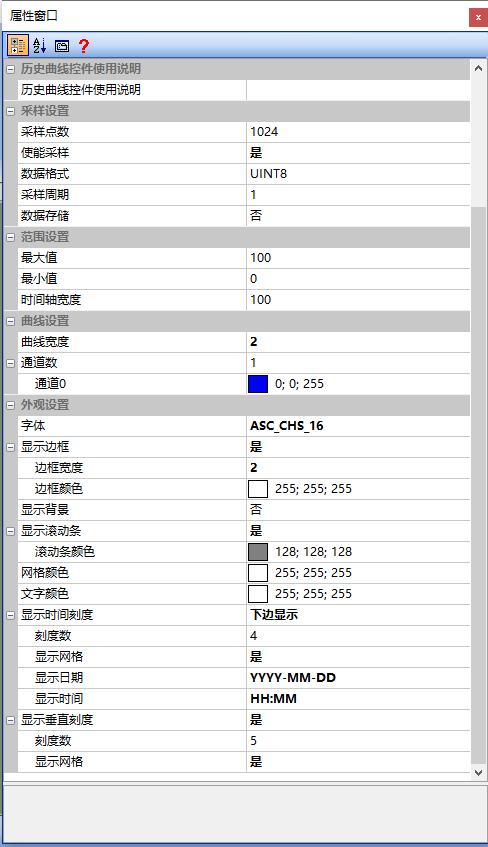
Number of sampling points
The total number of sampling points within the entire control width for a single channel. If the number of sampling points exceeds this value, the channel only saves the most recent sampling points.
Enable sampling
Set whether sampling is allowed during initialization, which can also be controlled through commands.
Data format
Data format of sampling points. When sending data to the historical curve, the high byte of the sampling value comes first, followed by the low byte. The format can be set as follows:
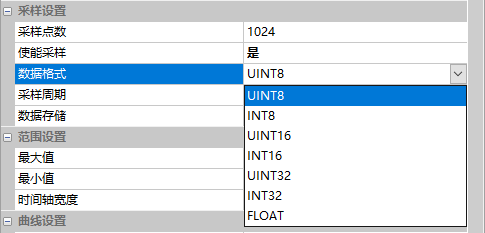
- UINT8: unsigned, single-byte integer
- INT: signed, single-byte integer
- UINT16: unsigned, double-byte integer
- INT16: signed, double-byte integer
- UINT32: unsigned, four-byte integer
- INT32: signed, four-byte integer
- FLOAT: single-precision floating-point number
Note: The data recording control and the historical curve share a storage block in the 128K flash. When enabling data storage, the storage address should be set.
Calculation of data storage address:
Data control storage size = maximum record count * single record size + 24 (unit: bytes)
Historical curve storage size = number of channels * number of sampling points + 30 (unit: bytes)
Sampling period
Time interval of sampling data, unit: seconds.
Data storage
Set whether to store sampling data in the user flash area of the screen.
Maximum value
The maximum value displayed at the top of the sampling value axis, default is 100.
Minimum value
The minimum value displayed at the bottom of the sampling value axis, default is 0.
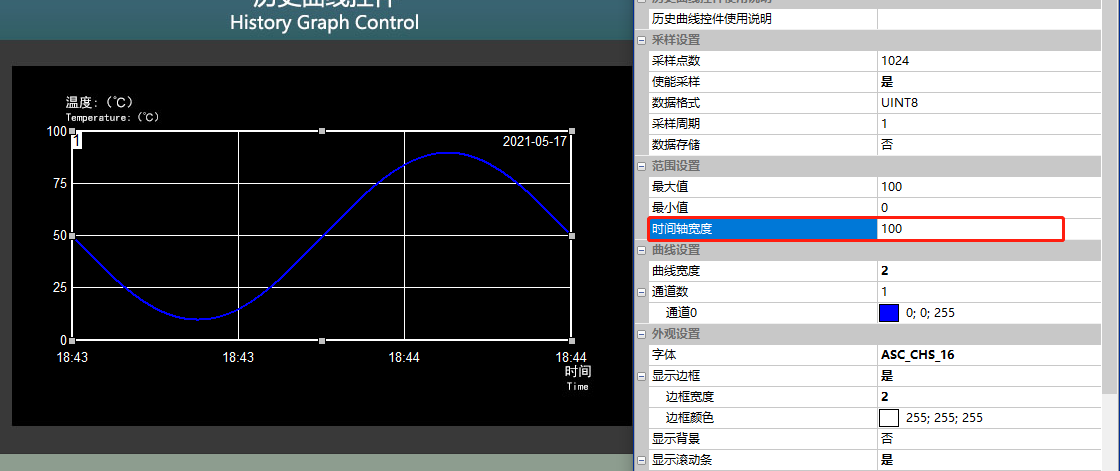
Time axis width
The number of sampling points within the horizontal range of the screen, default is 100, as shown below
Curve Width
The width of the curve line, with options of Level 1, 2, 3, and 4.
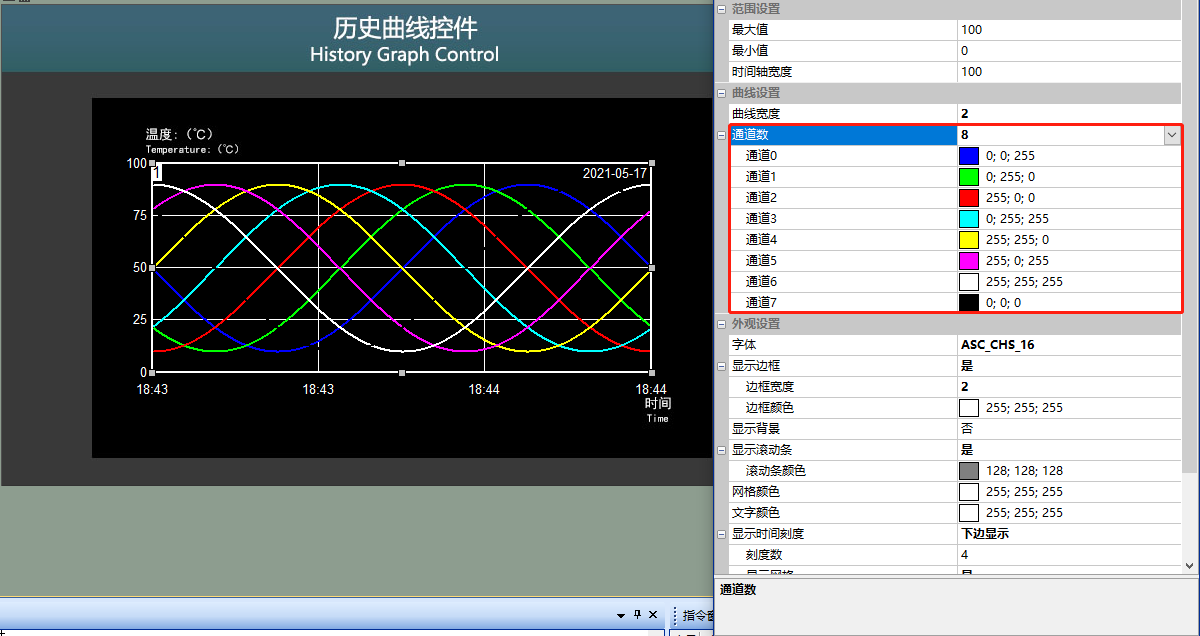
Number of Channels
The number of curve channels displayed on the control. A control can select up to 8 channels, and the color of each channel can be set individually, as shown below.
Font
The font size for displaying numerical values and time.
Display Border
Whether to display a border can be set. When a border is displayed, the width (set to "1" or "2") and color of the border can be set.
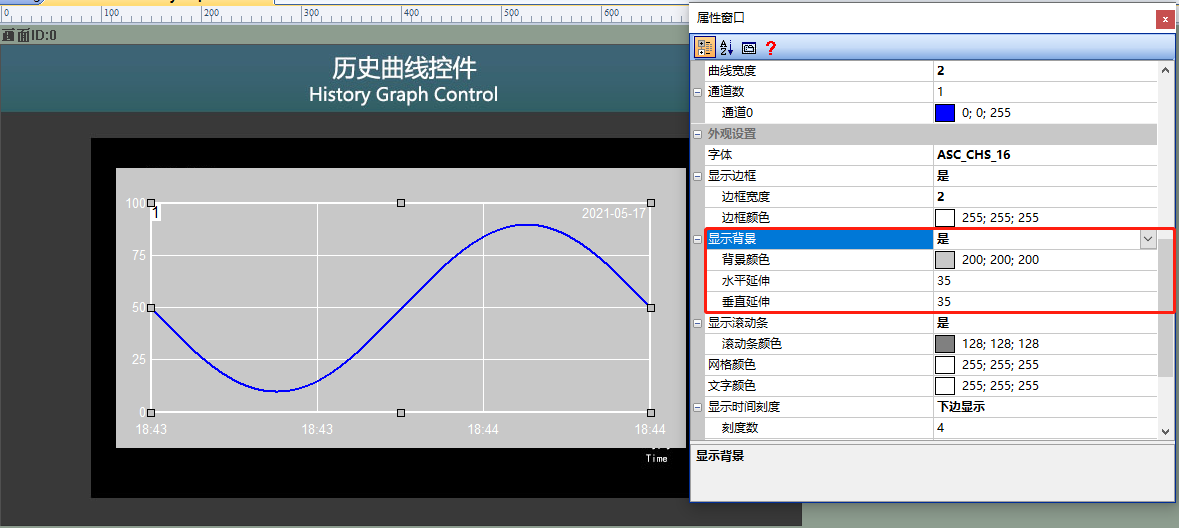
Display Background
The background color, horizontal extension, and vertical extension of the control can be set, with options of "Yes" or "No". When setting the display background to "Yes", the horizontal extension to 35, and the vertical extension to 35, as shown below.
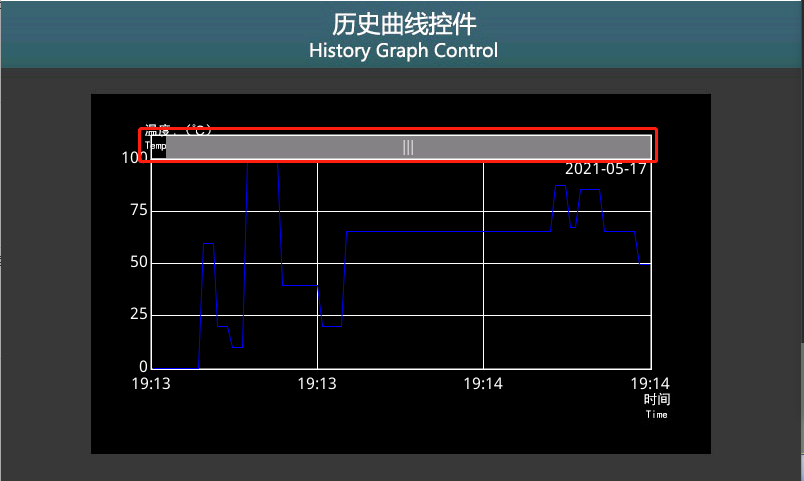
Display Scrollbar
Select "Yes" or "No". When the scrollbar is enabled, set the scrollbar properties, run the virtual screen, and the scrollbar will display above, allowing you to drag and view curves for all time points, as shown below
Grid Color
Set the color of the grid, supporting single-color settings.
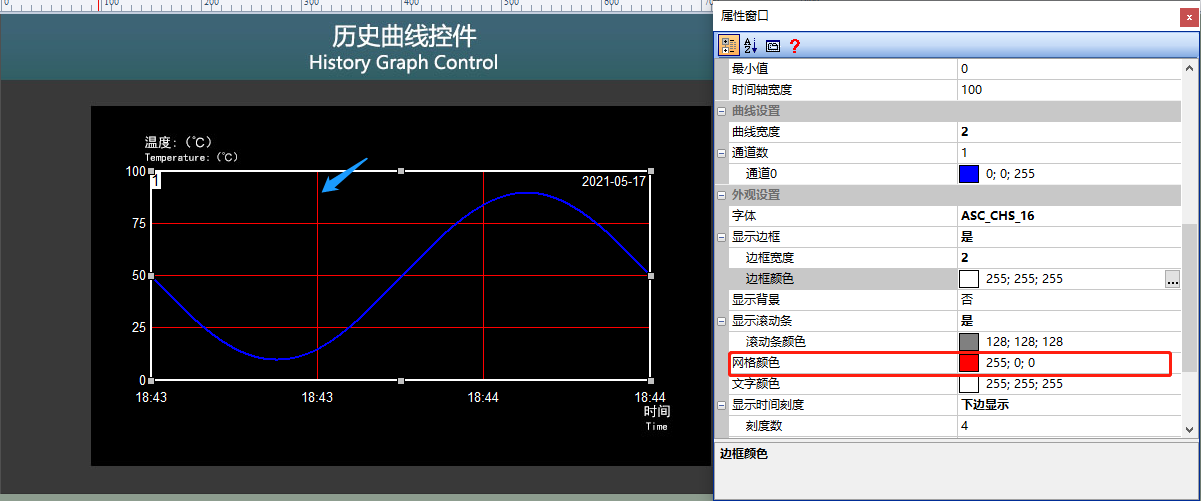
Text Color
Set the color display of text, including the values on the Y-axis, the time on the X-axis, and the date in the upper right corner.
Display Time Scale
Select from "No", "Display Below", or "Display Above". (When enabled, you can set the number of scales, whether to display the grid, whether to display the date, and whether to display the time.)
Display Vertical Scale
Set whether to display the scale values in the vertical direction. When displaying the vertical scale, you can set the number of scales and whether to display grid lines.
14.2 Historical Curve Function
The "Historical Curve Control" screen introduces how users can configure the basic properties and usage of the historical curve control.
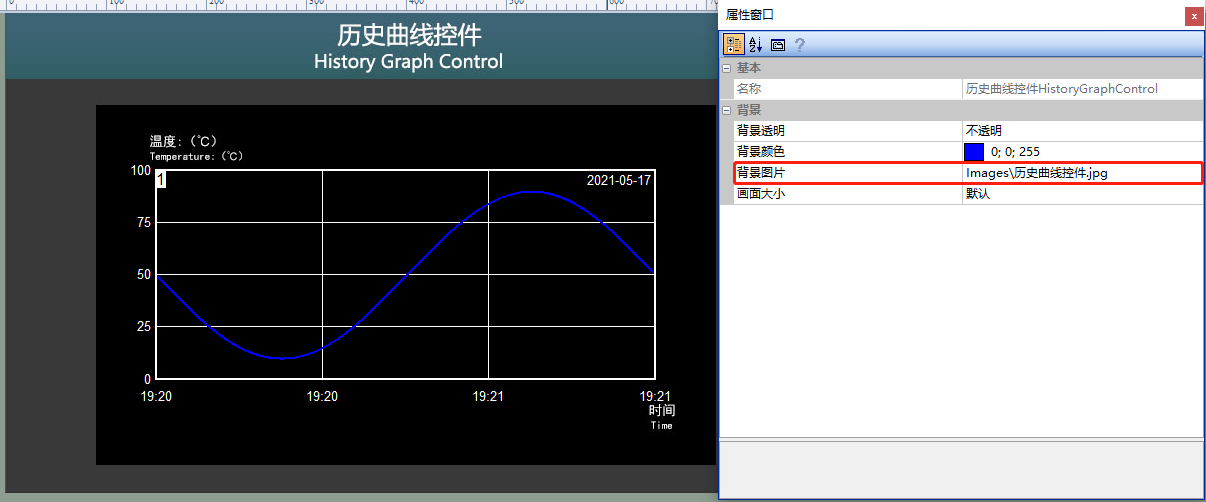
Screen Configuration
Import the corresponding artwork image in the "Background Image" of the "Historical Curve Control" screen. Add the historical curve control to this screen as shown below
Attribute Configuration
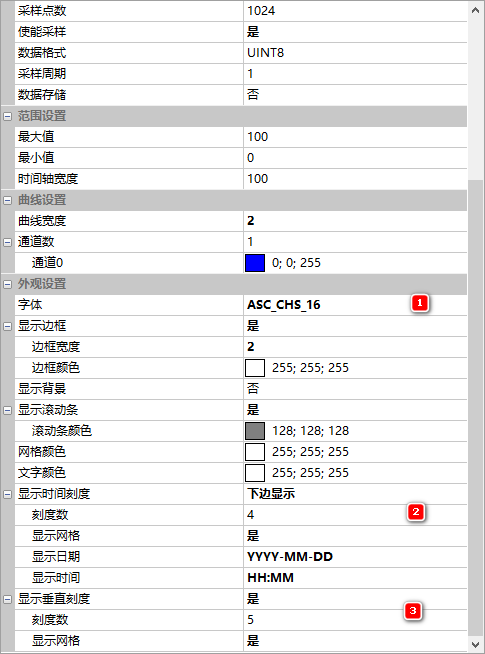
Historical curve control: Set the [Font] to [ASC_CHS_16], set the [Scale Count] for displaying the timeline to "4", set the [Scale Count] for displaying the vertical scale to "5", and keep the other settings as default. The configuration is shown below
Run Preview
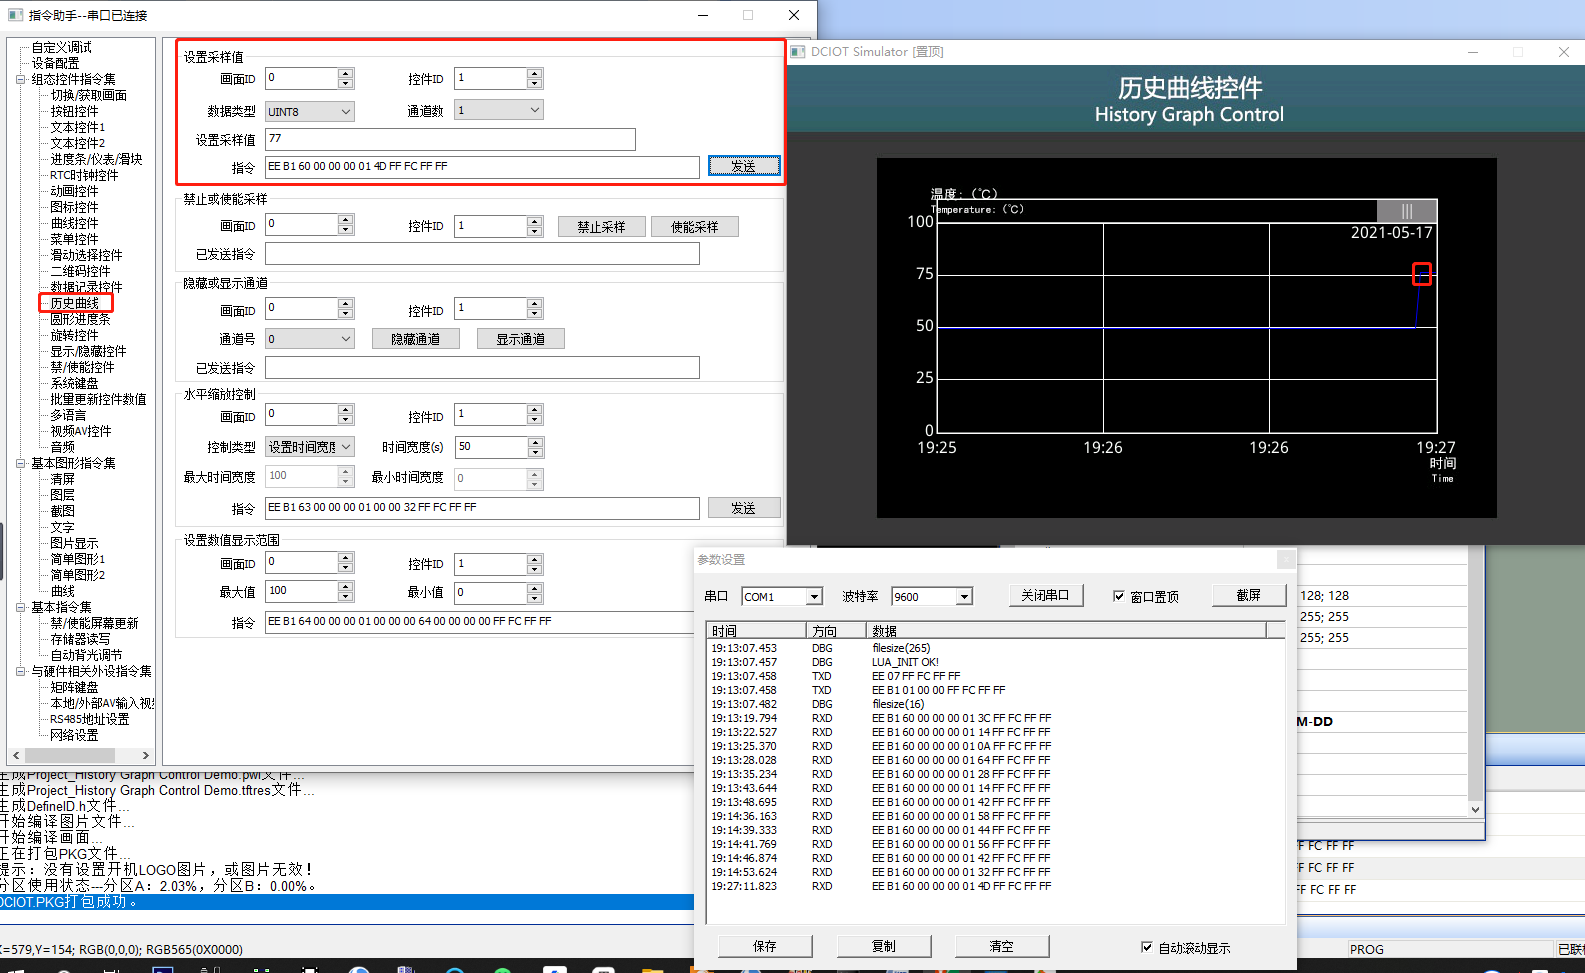
Run the virtual screen, establish a connection between the VisualTFT software and the virtual screen using "Virtual Serial Port", open the command assistant, select "Historical Curve" from the left navigation bar, and set the command parameters in the "Set Sampling Value" area. As in the example routine, set the screen ID to 0, control 1, data type to "UINT8", and the sampling value for channel number 1 to "77". The display effect is shown below
External MCU Control
Refer to the function declarations in the him.dever.h file and the definitions in the him.dever.c file in the Keil development package.
MCU Setting Sampling Values
Utilize the MCU to configure the number of sampling channels, data type, and sampling values for the historical curve. For instance, if the user wishes to set the sampling data type of the "Historical Curve Control" in the routine to "UINT8", specify the number of channels as "1", and set the sampling value to "77", they can directly call the historical curve control setting function, HistoryGraph_SetValueInt8(). The code is presented below.
/************************************************************************
** Function name:    void HistoryGraph_SetValueInt8 (uint16 screen_id,
**                                                   uint16 control_id,
**                                                   uint8 *value,
**                                                   uint8 channel);
** Descriptions    :  设置历史曲线采样值
** input parameters:  screen_id:   画面ID
**                    control_id:  控件ID
**                    *value:     设置的采样值
**                    channel    通道数
** output parameters: 无
** Returned value   :  无
************************************************************************/
{
    ......
    HistoryGraph_SetValueInt8(0,1,77,1);//画面0,控件1,通道1的采样值为77
    ......

}
MCU controls the disabling and enabling of sampling for the [historical curve control].
For example, if the user needs to enable or disable the sampling status of the [Historical Curve Control] on the current screen, they can directly call the historical curve control enable/disable function HistoryGraph_EnableSampling() as shown in the code below.
/************************************************************************
** Function name:    void HistoryGraph_EnableSampling (uint16 screen_id,
**                                                     uint16 control_id,
**                                                     uint8 enable);
** Descriptions    :  设置历史曲线控件的采样禁使能
** input parameters:  screen_id :  画面ID
**                    control_id:  控件ID
**                    value     :  禁止或使能(0代表禁止,1代表使能)
** output parameters: 无
** Returned value   : 无
************************************************************************/
{
    ......
    HistoryGraph_EnableSampling (0,1,1);//画面0,控件1的历史曲线控件使能采样
    ......
}

Leave a Reply