
Historical curve recording tracks the trend of variables over time, supporting up to 16 independent channels. The sampled data is stored in Flash, ensuring no loss during power loss. It supports paging, zooming, clearing, and CSV export. It serves as the main view for monitoring and energy efficiency evaluation.
1. Two data sources
| modes | definitions | purposes |
|---|---|---|
| data sampling | values of a single register at different time points, collected periodically to form a time series curve | Observe the historical trend of a single parameter |
| Continuous sampling | Read N consecutive registers at the same time, with N values plotted as a group on the same curve | Spatial distribution/batch data snapshot |
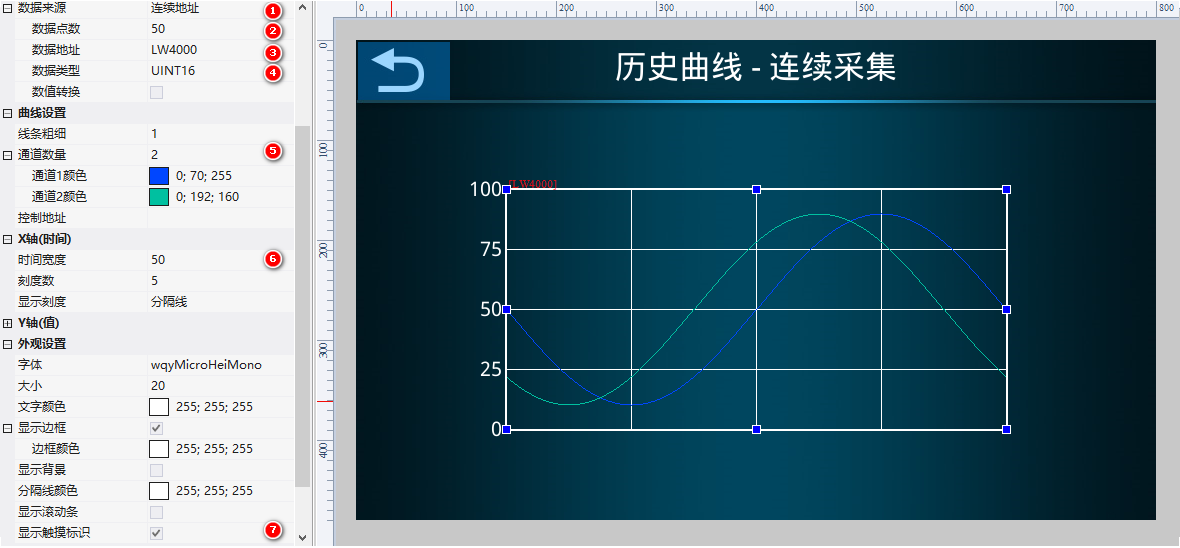
Continuous addressesAttribute: Data points 1~40000, data address (starting), data type (UINT16~DOUBLE), value conversion (actual value = transmitted value × scaling + offset).
Continuous sampling attention to channel distribution: data address 0x4000, points 50, channel 2 → channel 1 uses LW4000, LW4002, LW4004... (even addresses), channel 2 uses LW4001, LW4003... (odd addresses).
2. Curve settings
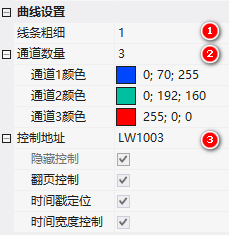
- Curve thickness: 1 or 2 pixels;Curve channels: up to 16;Channel color: color per channel
- Control address(Addr onwards):
| Offset | Function |
|---|---|
| Addr+0 | Channel Display/Hide: Bits 0-15 correspond to channels 1-15, where 0=display, 1=hide |
| Addr+1 | Page Turn Control: 1-Previous Page, 2-Next Page, 3-First Page (Latest), 4-Last Page (Oldest) |
| Addr+2 | Read Page Turn Feasibility: BIT1 for Previous Page, BIT2 for Next Page, BIT3 for First Page, BIT4 for Last Page, 1=executable |
| Addr+3~4 | Time Stamp Positioning (UINT32), with a dropdown menu for positioning by day |
| Addr+5 | Time Width Control: Points displayed per screen (control width 400, value 100 → 4 pixels/point) |
3. X-Axis (Time)/Y-Axis (Value)
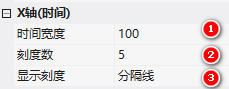
- X-axis: Time width (number of sampling points per page, e.g. 100; the curve shifts left after the 101st data point fills the screen); scale numbers 2~10; display scale (none/divider/scale line)
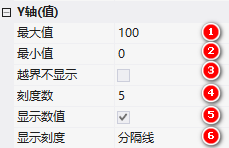
- Y-axis: Maximum/minimum value (can be dynamically modified through LUA, wgt_set_param 0x31=minimum value, 0x32=maximum value); do not display out-of-range values; scale numbers 2~11; display numerical values; display scale
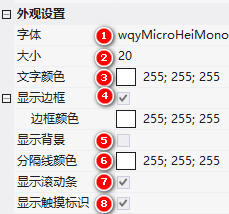
Appearance: font/size/color, border, background, divider color, scroll bar, touch indicator (touch curve displays sampling time and value).
4. Application case (data sampling)
4.1 Data sampling configuration
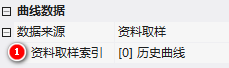
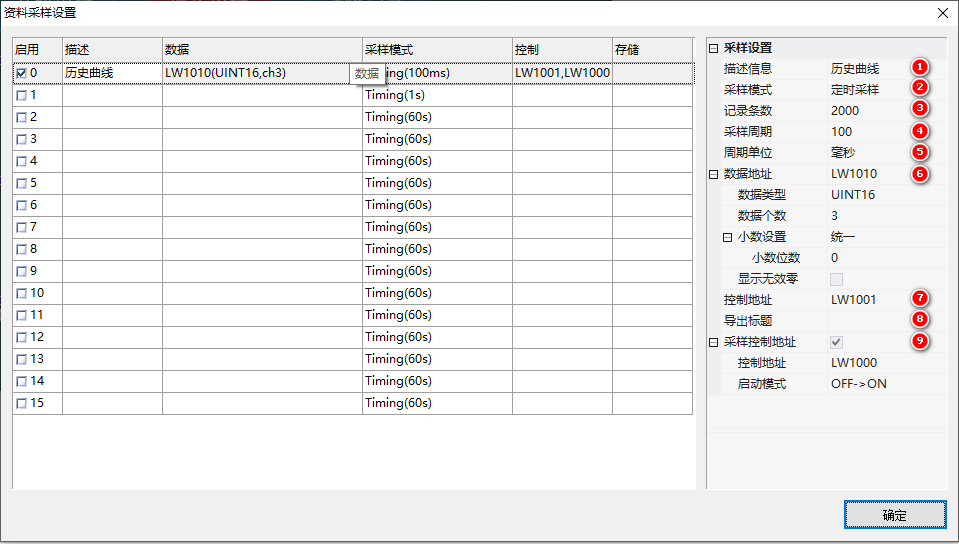
Describe "historical curve", perform scheduled sampling, record 2000 entries, cycle 100ms, data addressLW1010, INT16, number of data 3, control addressLW1001, sampling control addressLW1000, start mode OFF→ON.
4.2 Curve Control Configuration
Data source = data collection (index[0] historical data), channel count 3, control address0x1003(Hidden Control),0x1004(Page Turn),0x1005(Allow Page Turn, Read-Only),0x1006(Timestamp, INT32),0x1008(Time Width). Display Scroll Bar + Touch Identifier.
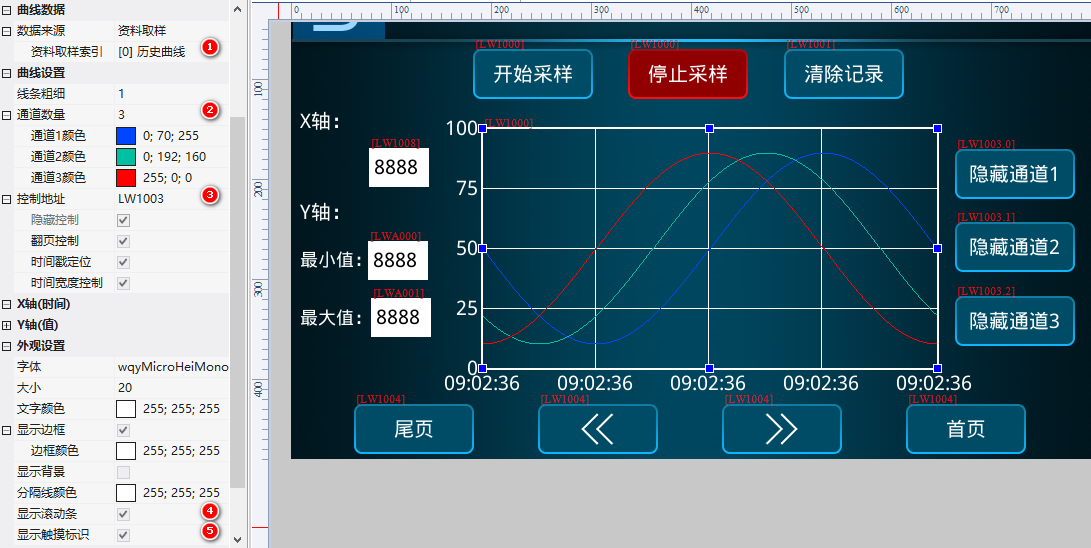
4.3 Sampling Enable + Clear + Channel Display
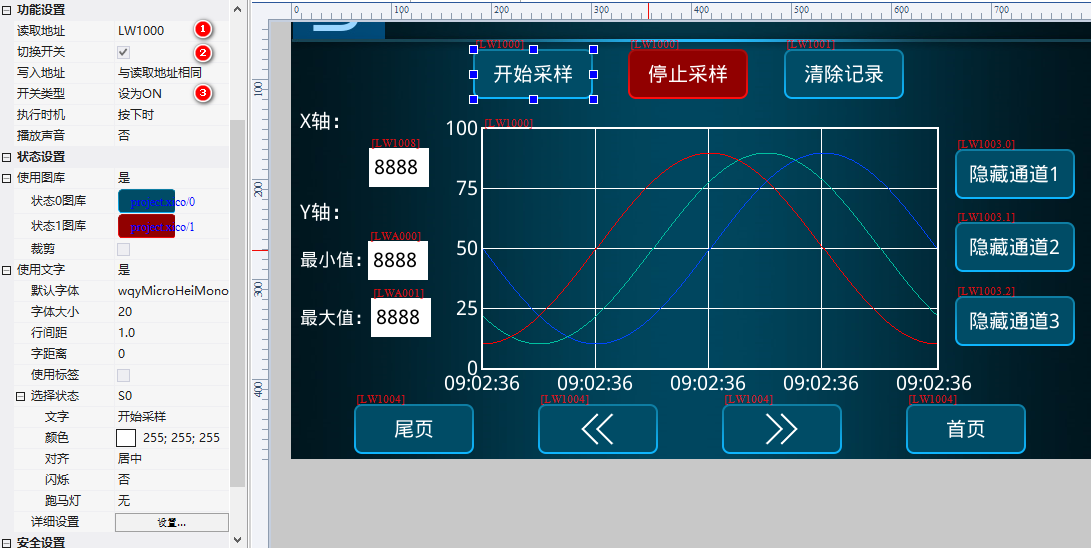
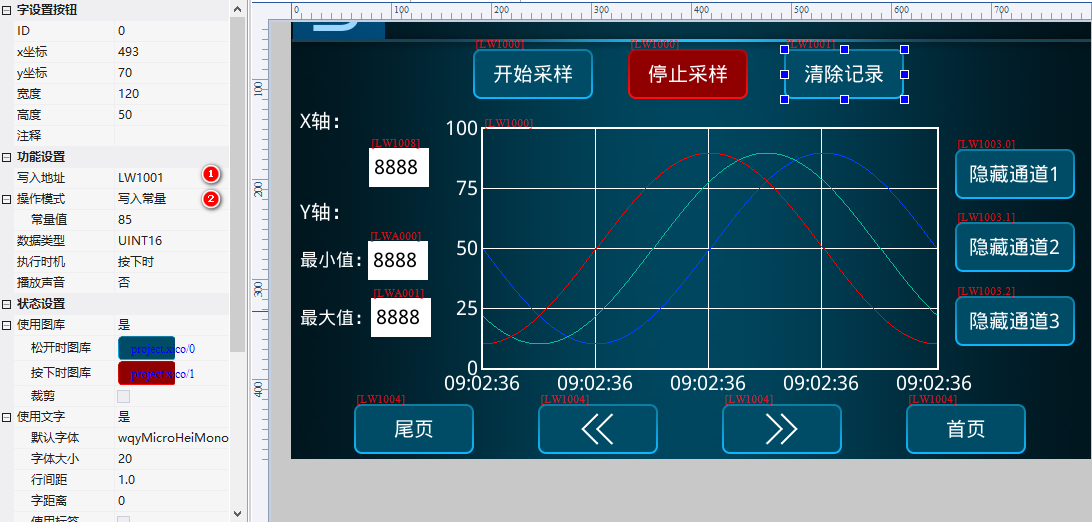
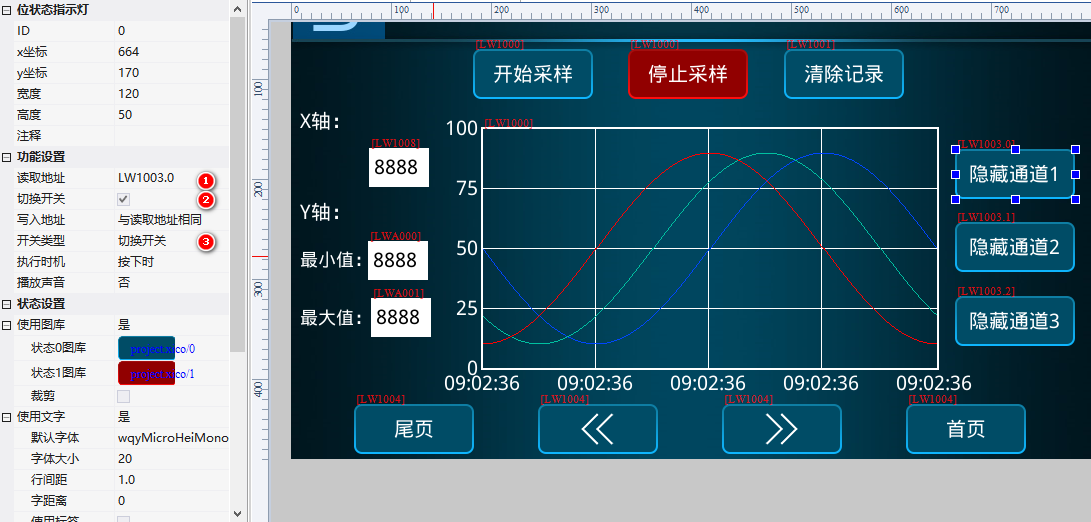
Bit Status Indicator BindingLW1000(Set to ON = Start Collection / Set to OFF = Stop); Word Button BindingLW1001Write 85 Clear; 3 Bit Buttons BindingLW1003.0/.1/.2Toggle Switch to Control Channel Display Hiding; 4 Page Turn Buttons BindingLW1004(1/2/3/4) + permission conditionLW1005.1/.2== 1.
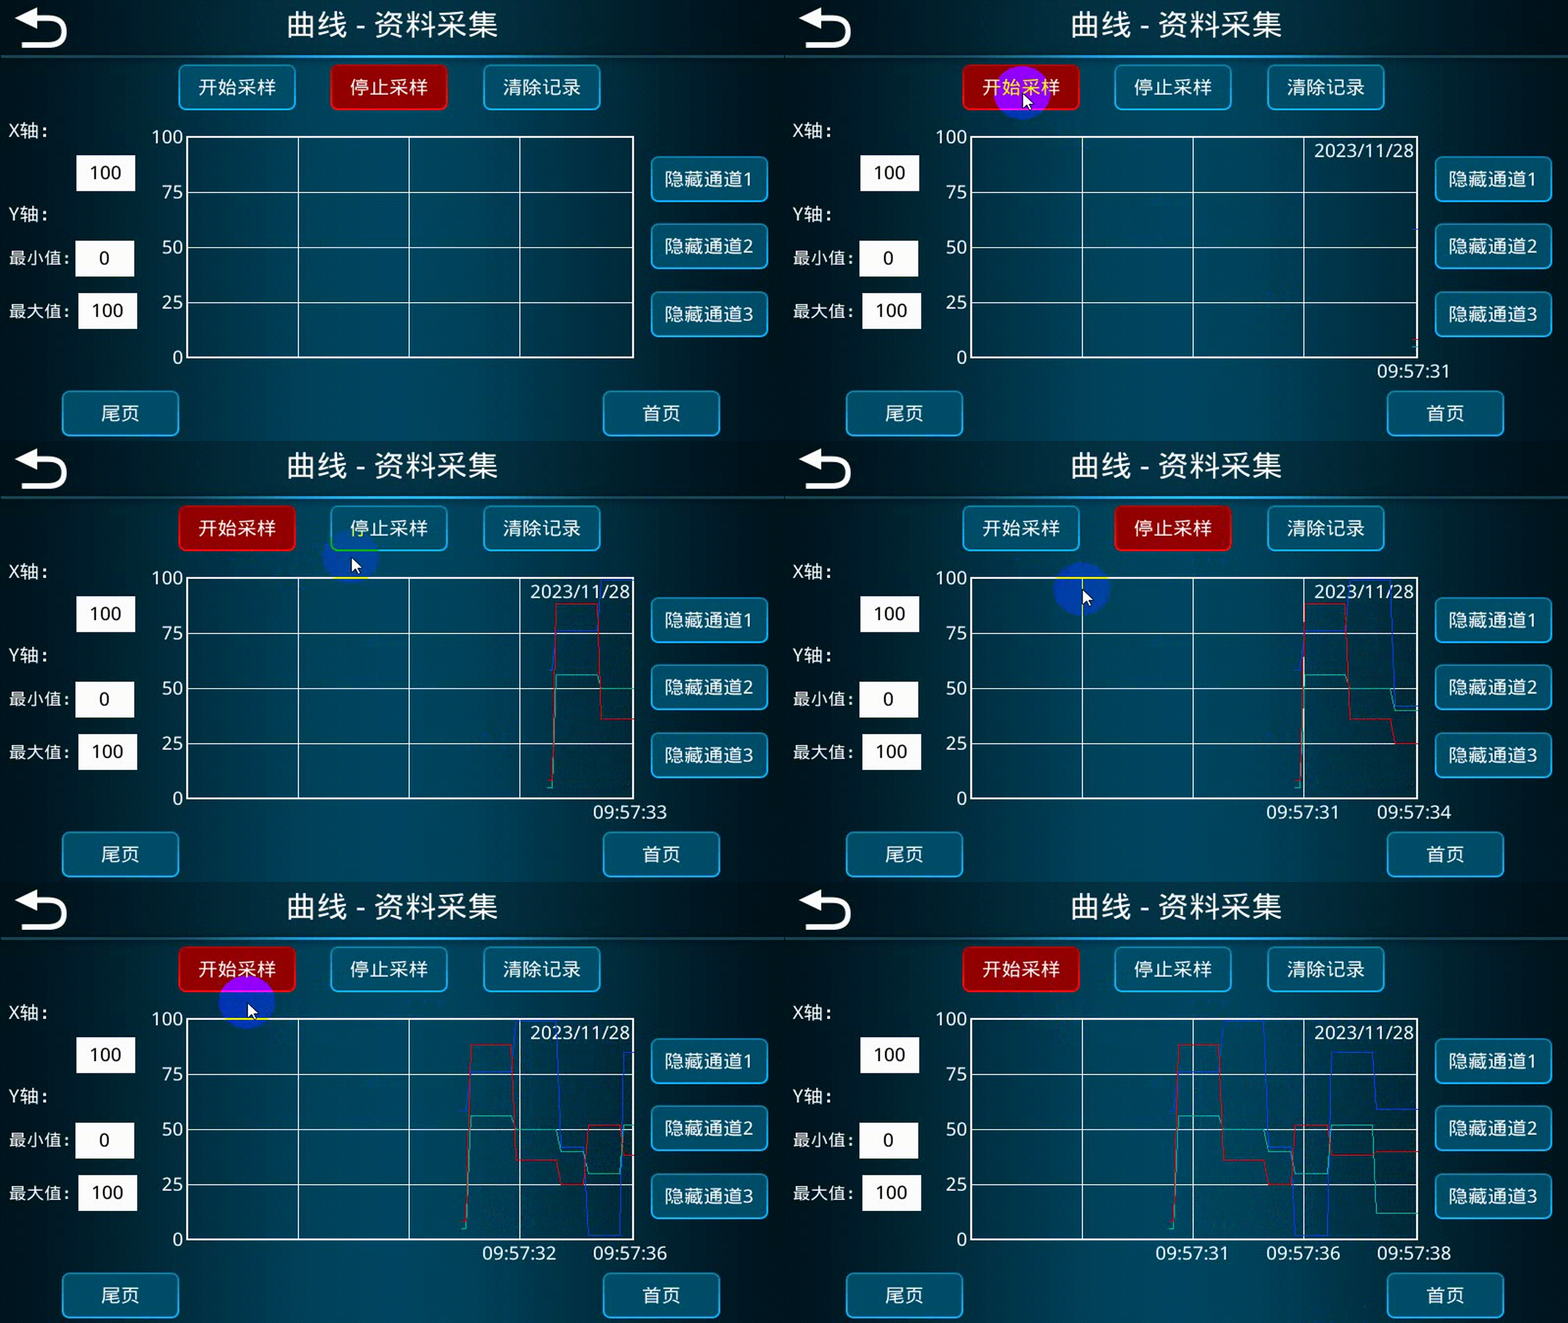
4.4 X-axis / Y-axis scaling
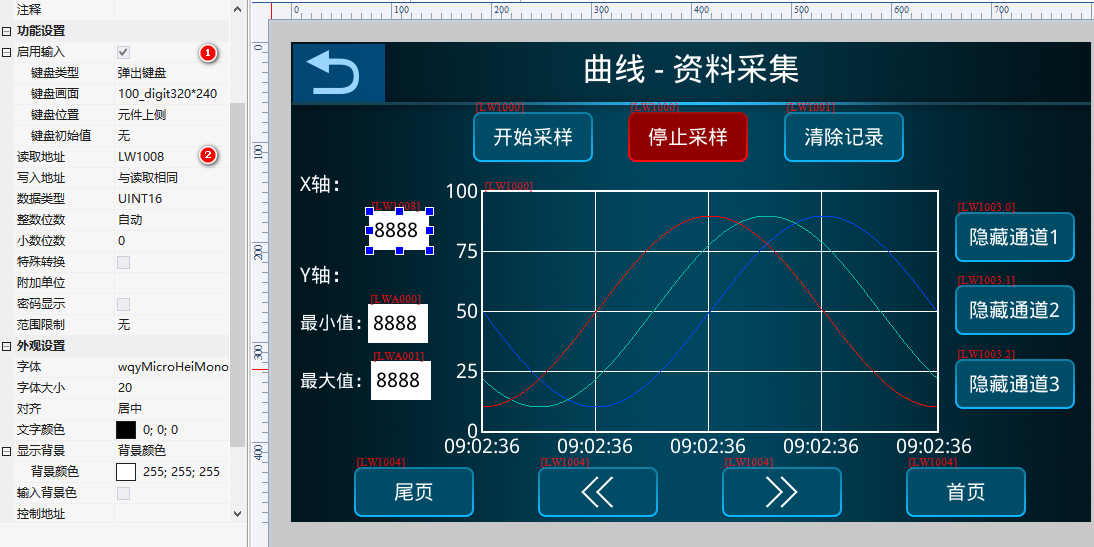
X-axis: numerical control bindingLW1008input 200→200 points on one screen, input 50→50 points. Y-axis: curve control ID set to 100 (not 0), change maximum/minimum values in LUA using wgt_set_param:
function on_update(slave, vtype, addr)
  if vtype == VT_LW then
    if addr == 0xA000 then
      wgt_set_param(__page._hisgraph1, 100, 0x31, get_uint16(VT_LW, 0xA000)) -- Y最小值
    elseif addr == 0xA001 then
      wgt_set_param(__page._hisgraph1, 100, 0x32, get_uint16(VT_LW, 0xA001)) -- Y最大值
    end
  end
end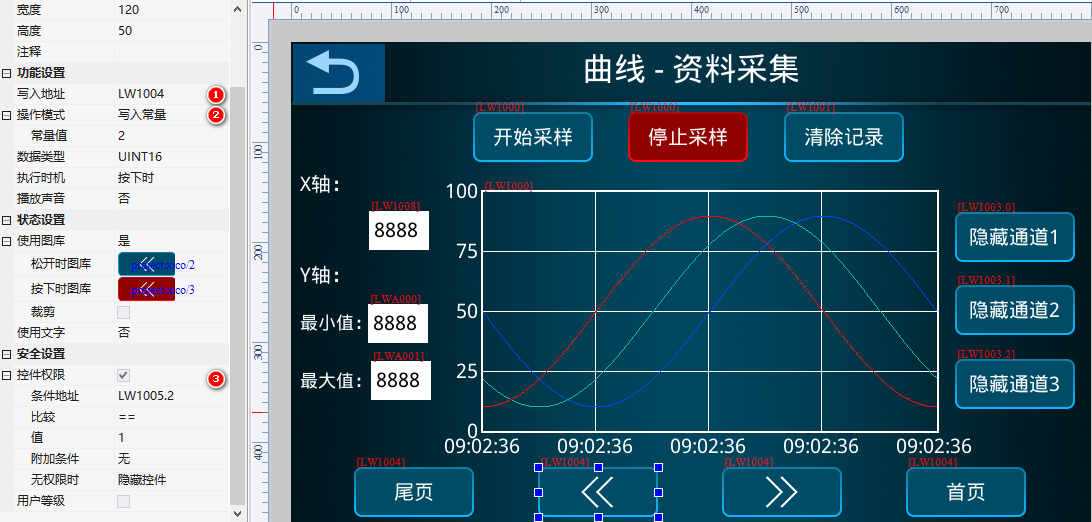
Compiled from the tutorial "Historical Curve" in the VisualHMI development document of Guangzhou Dacai Technology (hmi-doc.gz-dc.com), copyright reserved by Dacai Technology.


Leave a Reply