

1. Functional Overview
During the actual debugging process, we can utilize the simulation debugging function of TDFHUI to inspect and verify the interface effects and the transmission and reception of instructions, in order to achieve the desired design outcomes.
2. Preparation for Simulation Debugging
Prepare two serial port tools and connect them as shown in the figure below, ensuring they are plugged into the same computer. The connections should be made as follows: GND-GND, RXD-TXD, TXD-RXD, as depicted in Figure 2.1.
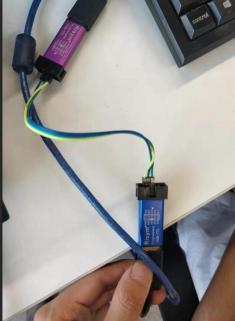 Figure 2.1 Serial Port Wiring Method
3. How to Simulate and Debug
3.1 How to Set the Simulation Port
Open an existing project file and click on "Simulation → Settings" in the menu bar or click the simulator settings button in the simulation debugging module
Figure 2.1 Serial Port Wiring Method
3. How to Simulate and Debug
3.1 How to Set the Simulation Port
Open an existing project file and click on "Simulation → Settings" in the menu bar or click the simulator settings button in the simulation debugging module
 . This will bring up the simulator settings window. Click the dropdown box for the simulator port and select either port from the two connected serial port tools, as shown in the figure.
In the simulator settings window, click the dropdown box of the simulator port, and select any of the two connected serial port tools as shown in the figure.
. This will bring up the simulator settings window. Click the dropdown box for the simulator port and select either port from the two connected serial port tools, as shown in the figure.
In the simulator settings window, click the dropdown box of the simulator port, and select any of the two connected serial port tools as shown in the figure.
 Figure 3.1 Simulation Settings

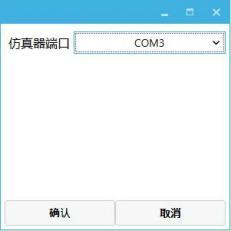 Figure 3.2 Simulator Settings Window
3.2 How to set up serial port debugging software
Click to open any serial port debugging software, click to set up the serial port (set the serial port to another serial tool port, which must be different from the simulator port) → baud rate setting → set receiving and transmitting to hex → click to open, as shown in Figure 3.3.
Figure 3.2 Simulator Settings Window
3.2 How to set up serial port debugging software
Click to open any serial port debugging software, click to set up the serial port (set the serial port to another serial tool port, which must be different from the simulator port) → baud rate setting → set receiving and transmitting to hex → click to open, as shown in Figure 3.3.
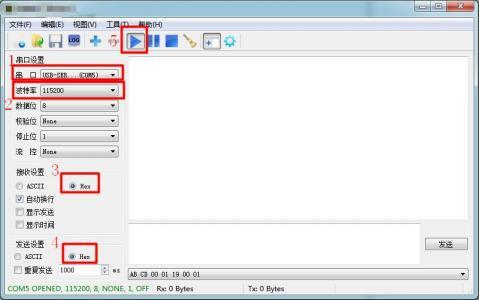 Figure 3.3 Serial port debugging software settings
3.3 How to simulate and demonstrate
Click the "Run" button in the simulation debugging module to pop up the simulation running window, as shown in Figure 3.4.
Figure 3.3 Serial port debugging software settings
3.3 How to simulate and demonstrate
Click the "Run" button in the simulation debugging module to pop up the simulation running window, as shown in Figure 3.4.
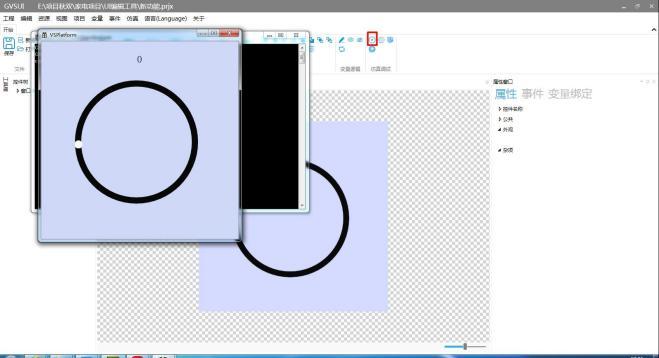 Figure 3.4 Simulation demonstration
Pull the running slider to send a custom command, and the serial port debugging software receives the sent command, as shown in Figure 3.5.
Figure 3.4 Simulation demonstration
Pull the running slider to send a custom command, and the serial port debugging software receives the sent command, as shown in Figure 3.5.
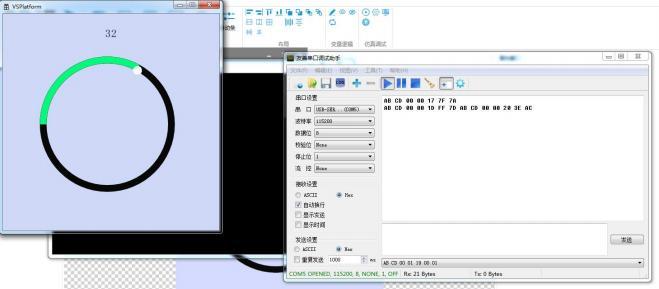 Figure 3.5 Simulation demonstration
Send a command through the serial port debugging software, and the circular slider in the simulation demonstration makes corresponding changes, as shown in Figure 3.6.
Figure 3.5 Simulation demonstration
Send a command through the serial port debugging software, and the circular slider in the simulation demonstration makes corresponding changes, as shown in Figure 3.6.
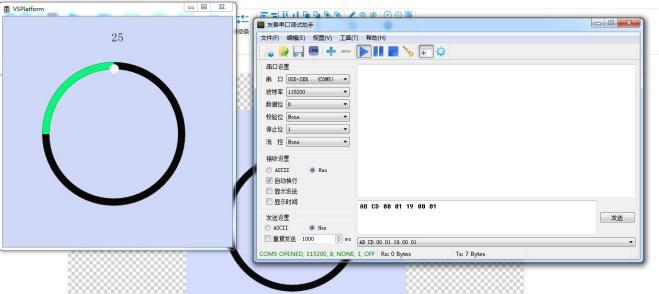 Figure 3.6 Simulation demonstration
If you have gained something, please give a thumbs up


Leave a Reply